2021 UK local government election
2021 Essex County Council election
|
|
All 75 seats to Essex County Council
38 seats needed for a majority |
|---|
| Turnout | 33.2% ( 2.1%) 2.1%) |
|---|
| | First party | Second party | Third party | | |  | | | | Leader | David Finch | Michael Mackrory | Ivan Henderson | | Party | Conservative | Liberal Democrats | Labour | | Leader since | May 2013 | May 2012 | June 2016 | | Leader's seat | Hedingham (Retiring) | Springfield | Harwich | | Last election | 56 seats, 49.3% | 7 seats, 13.7% | 6 seats, 16.9% | | Seats before | 51 | 8 | 6 | | Seats won | 52 | 8 | 5 | | Seat change |  4 4 | 1 | 1 | | Popular vote | 196,987 | 55,664 | 63,470 | | Percentage | 48.8% | 13.8% | 17.1% | | Swing | 0.5% | 0.1% | 0.2% |
| | | Fourth party | Fifth party | Sixth party | | | | | | | Leader | n/a | n/a | Dave Blackwell | | Party | Independent | R4U | CIIP | | Leader since | n/a | n/a | May 2013 | | Leader's seat | n/a | n/a | Canvey Island East | | Last election | 2 seats, 1.2% | 0 seats, 1.4% | 2 seats, 1.0% | | Seats before | 4 | 0 | 2 | | Seats won | 3 | 2 | 2 | | Seat change | 1 | 2 |  | | Popular vote | 23,689 | 9,732 | 4,121 | | Percentage | 5.9% | 2.4% | 1.0% | | Swing | 4.7% | 1.0% | 0.0% |
| | | Seventh party | Eighth party | Ninth party | | | | | | | Leader | James Abbott | Chris Pond | Michael Hoy | | Party | Green | Loughton Residents | Rochford Resident | | Leader since | May 2013 | May 2005 | May 2021 | | Leader's seat | Witham Northern (Defeated) | Loughton Central | Rochford West | | Last election | 1 seat, 4.3% | 1 seat, 1.2% | 0 seats, 1.1% | | Seats before | 1 | 1 | 0 | | Seats won | 1 | 1 | 1 | | Seat change | | | 1 | | Popular vote | 22,647 | 4,710 | 4,447 | | Percentage | 5.6% | 1.2% | 1.1% | | Swing | 1.3% | 0.4% | New | |
 Map showing the results of the 2021 Essex County Council election |
Council control before election
Conservative
| Council control after election
Conservative
| |
The 2021 Essex County Council election took place on 6 May 2021 as part of the 2021 United Kingdom local elections.[1] All 75 councillors were elected from 70 electoral divisions, with each returning either one or two councillors by first-past-the-post voting for a four-year term of office.
The electoral divisions were the same as those used at the previous elections in 2005, 2009, 2013 and 2017.
Previous composition
2017 election
| Party | Seats |
| | Conservative | 56 |
| | Liberal Democrats | 7 |
| | Labour | 6 |
| | CIIP | 2 |
| | Green | 1 |
| | Loughton Residents | 1 |
| | Independent | 2 |
| Total | 75 |
Composition of council seats before election
| Party | Seats |
| | Conservative | 51 |
| | Liberal Democrats | 8 |
| | Labour | 6 |
| | CIIP | 2 |
| | Green | 1 |
| | Loughton Residents | 1 |
| | Independent | 4 |
| Vacant | 2 |
| Total | 75 |
Changes between elections
In between the 2017 election and the 2021 election, the following council seats changed hands:
| Division | Date | Previous Party | New Party | Cause | Resulting Council Composition |
| Con | LDem | Lab | Ind | CInd | Grn | LRes |
| | | | | | | |
| Bocking | 6 April 2018 [2] | | Conservative | | Independent | Councillor suspended from party. | 55 | 7 | 6 | 3 | 2 | 1 | 1 |
| Clacton North | 2 October 2018 [3] | | Conservative | | Liberal Democrats | Sitting Conservatives Councillor defected to Liberal Democrats. | 54 | 8 | 6 | 3 | 2 | 1 | 1 |
| Halstead | 21 February 2019 [4] | | Conservative | | Independent | Councillor quit party to sit as an independent member. | 53 | 8 | 6 | 4 | 2 | 1 | 1 |
| Rochford North | 1 April 2020 [5] | | Conservative | | Vacant | Sitting councillor died [6] | 52 | 8 | 6 | 4 | 2 | 1 | 1 |
| Chigwell & Loughton Broadway | 13 April 2021 [7] | | Conservative | | Vacant | Sitting councillor resigned.[8] | 51 | 8 | 6 | 4 | 2 | 1 | 1 |
Summary
Election result
| 2021 Essex County Council election |
| Party | Candidates | Seats | Gains | Losses | Net gain/loss | Seats % | Votes % | Votes | +/− |
| | Conservative | 75 | 52 | 3 | 7 | 4 | 69.3 | 48.8 | 196,987 | –0.5 |
| | Liberal Democrats | 70 | 8 | 3 | 2 | 1 | 10.7 | 13.8 | 55,664 | +0.1 |
| | Labour | 75 | 5 | 0 | 1 | 1 | 6.7 | 17.1 | 69,045 | +0.2 |
| | Independent | 20 | 3 | 1 | 0 | 1 | 4.0 | 5.9 | 23,689 | +4.7 |
| | R4U | 4 | 2 | 2 | 0 | 2 | 2.7 | 2.4 | 9,732 | +1.0 |
| | CIIP | 2 | 2 | 0 | 0 | | 2.7 | 1.0 | 4,121 | ±0.0 |
| | Green | 41 | 1 | 1 | 1 | | 1.3 | 5.6 | 22,647 | +1.3 |
| | Loughton Residents | 2 | 1 | 0 | 0 | | 1.3 | 1.2 | 4,710 | +0.4 |
| | Rochford Resident | 2 | 1 | 1 | 0 | 1 | 1.3 | 1.1 | 4,447 | N/A |
| | Reform UK | 17 | 0 | 0 | 0 | | 0.0 | 0.6 | 2,614 | N/A |
| | Tendring First | 3 | 0 | 0 | 0 | | 0.0 | 0.5 | 2,029 | +0.1 |
| | Wickford Independents | 1 | 0 | 0 | 0 | | 0.0 | 0.4 | 1,600 | –0.4 |
| | Ind. Network | 1 | 0 | 0 | 0 | | 0.0 | 0.4 | 1,520 | N/A |
| | Harlow Alliance | 2 | 0 | 0 | 0 | | 0.0 | 0.4 | 1,511 | N/A |
| | UKIP | 4 | 0 | 0 | 0 | | 0.0 | 0.3 | 1,032 | –7.6 |
| | SWFCTA | 1 | 0 | 0 | 0 | | 0.0 | 0.2 | 979 | ±0.0 |
| | Holland Residents | 1 | 0 | 0 | 0 | | 0.0 | 0.1 | 554 | N/A |
| | For Britain | 3 | 0 | 0 | 0 | | 0.0 | 0.1 | 380 | N/A |
| | English Democrat | 1 | 0 | 0 | 0 | | 0.0 | <0.1 | 186 | ±0.0 |
| | Democratic Network | 1 | 0 | 0 | 0 | | 0.0 | <0.1 | 135 | N/A |
| | Workers Party | 1 | 0 | 0 | 0 | | 0.0 | <0.1 | 94 | N/A |
| | Freedom Alliance (UK) | 1 | 0 | 0 | 0 | | 0.0 | <0.1 | 89 | N/A |
| | Young People's Party UK | 1 | 0 | 0 | 0 | | 0.0 | <0.1 | 45 | N/A |
Election of Group Leaders
Kevin Bentley (Stanway and Pyefleet) was elected leader of the Conservative Group, with Louise McKinlay (Brentwood Hutton) as his deputy.
Michael Mackrory (Springfield) was re elected leader of the Liberal Democratic Group, with David King (Mile End and Highwoods) as his deputy.
Ivan Henderson (Harwich) was re elected leader of the Labour Group, with Adele Brown (Laindon Park & Fryerns) as his deputy.
Chris Pond (Loughton Central) was re elected leader of the Non-Aligned Group with Michael Hoy (Rochford West) as his deputy.
Election of Leader of the Council
Kevin Bentley the leader of the conservative group was duly elected leader of the council and formed a conservative administration.
Results by District
Basildon
District Summary
| Party | Seats | +/- | Votes | % | +/- |
| | Conservative | 6 | | 35,731 | 52.6 | +3.6 |
| | Labour | 2 | | 16,252 | 23.9 | +2.8 |
| | Independent | 1 | | 5,082 | 7.5 | −2.3 |
| | Liberal Democrat | 0 | | 6,934 | 10.2 | +4.2 |
| | Wickford Ind. | 0 | | 1,660 | 2.4 | N/A |
| | Reform UK | 0 | | 1,479 | 2.2 | N/A |
| | UKIP | 0 | | 684 | 1.0 | −12.0 |
| | TUSC | 0 | | 49 | 0.1 | N/A |
Division Results
Basildon Westley Heights | Party | Candidate | Votes | % | ±% |
| | Independent | Kerry Smith * | 3,655 | 60.5 | 0.1 |
| | Conservative | Charlie Sansom | 1,404 | 23.3 | 0.8 |
| | Labour | Kayode Adekunle Adeniran | 627 | 10.4 | 0.5 |
| | Liberal Democrats | Timothy Nicklin | 205 | 3.4 | 1.9 |
| | Independent | None of the Above X | 98 | 1.6 | N/A |
| | TUSC | David Murray | 49 | 0.8 | N/A |
| Majority | 2,251 | 37.2 | 0.7 |
| Turnout | 6,038 | 34.8 | 1.2 |
| | Independent hold | Swing | 0.4 | |
Billericay & Burstead (2 seats) | Party | Candidate | Votes | % | ±% |
| | Conservative | Anthony Hedley * | 6,311 | 60.3 | 9.3 |
| | Conservative | Richard Moore * | 5,364 | 51.3 | 11.6 |
| | Liberal Democrats | Edward Sainsbury | 2,751 | 26.3 | 15.9 |
| | Liberal Democrats | Laura Clark | 1,695 | 16.2 | 8.5 |
| | Labour | Tracey Hilton | 1,165 | 11.1 | 1.0 |
| | Labour | Malcolm Reid | 930 | 8.9 | 0.6 |
| | UKIP | Susan McCaffery | 315 | 3.0 | 4.0 |
| Turnout | 10,458 | 37.6 | 5.0 |
| | Conservative hold |
| | Conservative hold |
Laindon Park & Fryerns (2 seats) | Party | Candidate | Votes | % | ±% |
| | Conservative | Jeff Henry * | 3,206 | 41.3 | 5.6 |
| | Labour | Adele Brown | 2,668 | 34.4 | 1.6 |
| | Conservative | Andrew Schrader | 2,558 | 33.0 | 0.8 |
| | Labour | Allan Davies * | 2,358 | 30.4 | 4.7 |
| | Independent | Tony Low | 493 | 6.4 | N/A |
| | Reform UK | Lewis Fripp | 413 | 5.3 | N/A |
| | UKIP | Fred Southgate | 369 | 4.8 | 18.1 |
| | Reform UK | Norma Saggers | 331 | 4.3 | N/A |
| | Liberal Democrats | Vivien Howard | 324 | 4.2 | 1.0 |
| | Liberal Democrats | Michael Chandler | 321 | 4.1 | 0.7 |
| Turnout | 7,760 | 25.1 | 4.1 |
| | Conservative hold |
| | Labour hold |
Pitsea (2 seats) | Party | Candidate | Votes | % | ±% |
| | Conservative | Luke MacKenzie | 3,573 | 41.5 | 3.7 |
| | Labour | Aidan McGurran | 3,257 | 37.8 | 2.9 |
| | Labour | Patricia Reid * | 3,115 | 36.1 | 1.0 |
| | Conservative | Craig Rimmer | 3,091 | 35.9 | 3.0 |
| | Reform UK | Daniel Tooley | 501 | 5.8 | N/A |
| | Liberal Democrats | Martin Howard | 454 | 5.3 | 0.3 |
| | Liberal Democrats | Philip Jenkins | 422 | 4.9 | 0.6 |
| Turnout | 8,619 | 26.3 | 4.1 |
| | Conservative hold |
| | Labour hold |
Wickford Crouch (2 seats) | Party | Candidate | Votes | % | ±% |
| | Conservative | Tony Ball * | 5,752 | 63.7 | 8.0 |
| | Conservative | Malcolm Buckley * | 4,472 | 49.5 | 1.4 |
| | Wickford Ind. | Eunice Brockman | 1,660 | 18.4 | 1.3 |
| | Labour | Mark Burton-Sampson | 1,131 | 12.5 | 0.1 |
| | Labour | Gillian Palmer | 1,001 | 11.1 | 0.5 |
| | Independent | Sean Barlow | 836 | 9.3 | N/A |
| | Liberal Democrats | Nicola Hoad | 386 | 4.3 | 0.3 |
| | Liberal Democrats | Simon Blake | 376 | 4.2 | N/A |
| | Reform UK | Neil Huntley | 234 | 2.6 | N/A |
| Turnout | 9,035 | 29.1 | 3.1 |
| | Conservative hold |
| | Conservative hold |
Braintree
District Summary
| Party | Seats | +/- | Votes | % | +/- |
| | Conservative | 7 | | 18,352 | 51.1 | −3.7 |
| | Green | 1 | | 6,293 | 17.5 | +7.2 |
| | Labour | 0 | | 5,831 | 16.2 | −2.1 |
| | Independent | 0 | | 3,668 | 10.2 | N/A |
| | Liberal Democrat | 0 | | 1,778 | 4.9 | −3.3 |
Division Results
Bocking | Party | Candidate | Votes | % | ±% |
| | Conservative | Lynette Bowers-Flint | 2,179 | 58.3 | +3.0 |
| | Labour | Moia Thorogood | 912 | 24.4 | −1.2 |
| | Green | Richard Unsworth | 455 | 12.2 | +8.1 |
| | Liberal Democrats | James Card | 192 | 5.1 | −0.5 |
| Majority | 1,267 | 33.9 | +4.2 |
| Turnout | 3,738 | 27.3 | −0.3 |
| | Conservative hold | Swing | 2.1 | |
Braintree Eastern | Party | Candidate | Votes | % | ±% |
| | Green | Paul Thorogood | 2,573 | 49.4 | +39.6 |
| | Conservative | Robert Mitchell * | 1,980 | 38.0 | −18.8 |
| | Labour | Robert Powers | 511 | 9.8 | −6.6 |
| | Liberal Democrats | Barry Fleet | 149 | 2.9 | −7.9 |
| Majority | 593 | 11.4 | — |
| Turnout | 5,213 | 38.7 | +5.8 |
| | Green gain from Conservative | Swing | 29.2 | |
Braintree Town | Party | Candidate | Votes | % | ±% |
| | Conservative | Tom Cunningham | 2,185 | 56.9 | +5.5 |
| | Labour | Keiran Martin | 900 | 23.4 | −5.1 |
| | Independent (Green) | Colin Riches | 509 | 13.3 | N/A |
| | Liberal Democrats | Kate Onions | 246 | 6.4 | −0.2 |
| Majority | 1,285 | 33.5 | +10.7 |
| Turnout | 3,840 | 27.2 | +1.2 |
| | Conservative hold | Swing | 5.3 | |
Halstead | Party | Candidate | Votes | % | ±% |
| | Conservative | Christopher Siddall | 2,118 | 43.9 | −15.4 |
| | Independent (Green) | Jo Beavis * | 1,835 | 38.1 | N/A |
| | Labour | Garry Warren | 749 | 15.5 | −4.3 |
| | Liberal Democrats | Andrew Waugh | 119 | 2.5 | −4.9 |
| Majority | 283 | 5.8 | −33.7 |
| Turnout | 4,821 | 31.0 | +2.4 |
| | Conservative hold | Swing | 26.8 | |
Hedingham | Party | Candidate | Votes | % | ±% |
| | Conservative | Peter Schwier | 3,183 | 63.4 | −1.5 |
| | Labour | Shan Newhouse | 747 | 14.9 | +3.0 |
| | Green | Mark Posen | 645 | 12.9 | +8.0 |
| | Liberal Democrats | Mark Galvin | 445 | 8.9 | −2.0 |
| Majority | 2.436 | 48.5 | −4.4 |
| Turnout | 5,020 | 34.6 | +0.5 |
| | Conservative hold | Swing | 2.3 | |
Three Fields with Great Notley | Party | Candidate | Votes | % | ±% |
| | Conservative | Graham Butland * | 2,307 | 53.8 | −9.2 |
| | Independent (Green) | Michael Staines | 1,182 | 27.5 | N/A |
| | Labour | Jack Coleman | 446 | 10.4 | −1.6 |
| | Liberal Democrats | Graham Sheppard | 357 | 8.3 | −1.7 |
| Majority | 1,125 | 26.3 | −24.7 |
| Turnout | 4,292 | 35.2 | +2.2 |
| | Conservative hold | Swing | 18.4 | |
Witham Northern | Party | Candidate | Votes | % | ±% |
| | Conservative | Ross Playle | 2,051 | 42.6 | +6.8 |
| | Green | James Abbott * | 2,012 | 41.7 | +3.8 |
| | Labour | Phil Barlow | 615 | 12.8 | −2.9 |
| | Independent | David Hodges | 142 | 3.0 | N/A |
| Majority | 39 | 0.9 | — |
| Turnout | 4,820 | 33.3 | +0.7 |
| | Conservative gain from Green | Swing | 1.5 | |
Witham Southern | Party | Candidate | Votes | % | ±% |
| | Conservative | Derrick Louis * | 2,349 | 56.2 | +5.1 |
| | Labour | Leanora Headley | 951 | 22.8 | +3.2 |
| | Green | Philip Hughes | 608 | 14.6 | +7.9 |
| | Liberal Democrats | Charles Ryland | 270 | 6.5 | −4.1 |
| Majority | 1,398 | 33.4 | +1.9 |
| Turnout | 4,178 | 27.6 | +0.6 |
| | Conservative hold | Swing | 1.0 | |
Brentwood
District Summary
| Party | Seats | +/- | Votes | % | +/- |
| | Conservative | 3 | 1 | 10,303 | 50.2 | −2.8 |
| | Liberal Democrat | 1 | 1 | 6,165 | 28.6 | −2.5 |
| | Labour | 0 | | 2,388 | 11.1 | +2.4 |
| | Green | 0 | | 1,391 | 6.5 | +2.8 |
| | Reform UK | 0 | | 241 | 1.1 | N/A |
Division Results
Brentwood Hutton | Party | Candidate | Votes | % | ±% |
| | Conservative | Louise McKinlay * | 3,248 | 62.6 | −9.5 |
| | Labour | Liam Preston | 563 | 10.8 | +0.6 |
| | Independent | Amanda Burham-Burton | 557 | 10.7 | N/A |
| | Liberal Democrats | Philip Mynott | 546 | 10.5 | −2.3 |
| | Green | Juliette Rey | 275 | 5.3 | +3.5 |
| Majority | 2,685 | 51.8 | −7.5 |
| Turnout | 5,228 | 34.1 | +2.1 |
| | Conservative hold | Swing | 5.1 | |
Brentwood North | Party | Candidate | Votes | % | ±% |
| | Liberal Democrats | Barry Aspinell * | 2,552 | 47.7 | −3.3 |
| | Conservative | Jon Cloak | 1,851 | 34.6 | −0.7 |
| | Labour | Deborah Foster | 459 | 8.6 | +2.6 |
| | Green | Kelda Boothroyd | 374 | 7.0 | +4.9 |
| | Reform UK | William Hughes | 111 | 2.1 | N/A |
| Majority | 701 | 13.1 | −2.6 |
| Turnout | 5,347 | 37.1 | +2.6 |
| | Liberal Democrats hold | Swing | 1.3 | |
Brentwood Rural | Party | Candidate | Votes | % | ±% |
| | Conservative | Lesley Wagland * | 3,680 | 64.8 | −0.7 |
| | Liberal Democrats | Darryl Sankey | 1,189 | 20.9 | +5.0 |
| | Green | Paul Jeater | 410 | 7.2 | +3.8 |
| | Labour | Cameron Ball | 401 | 7.1 | +0.2 |
| Majority | 2,491 | 43.9 | −5.7 |
| Turnout | 5,680 | 39.3 | −10.3 |
| | Conservative hold | Swing | 2.9 | |
Brentwood South | Party | Candidate | Votes | % | ±% |
| | Conservative | Andy Wiles | 2,031 | 38.1 | +0.5 |
| | Liberal Democrats | David Kendall * | 1,878 | 35.2 | −10.9 |
| | Labour | Susan Kortlandt | 965 | 18.1 | +6.1 |
| | Green | John Hamilton | 332 | 6.2 | +1.9 |
| | Reform UK | Dave Conway | 130 | 2.4 | N/A |
| Majority | 153 | 2.9 | — |
| Turnout | 5,336 | 35.1 | +4.5 |
| | Conservative gain from Liberal Democrats | Swing | 5.7 | |
Castle Point
District Summary
| Party | Seats | +/- | Votes | % | +/- |
| | Conservative | 3 | | 10,295 | 44.2 | −10.0 |
| | CIIP | 2 | | 4,121 | 17.7 | −0.3 |
| | Independent | 0 | | 5,129 | 22.0 | N/A |
| | Labour | 0 | | 2,635 | 13.0 | −0.4 |
| | Liberal Democrat | 0 | | 642 | 2.8 | +0.3 |
| | Reform UK | 0 | | 132 | 0.6 | N/A |
Division Results
Canvey Island East | Party | Candidate | Votes | % | ±% |
| | CIIP | David Blackwell * | 2,289 | 51.3 | +4.0 |
| | Conservative | Owen Cartey | 1,610 | 36.1 | +3.6 |
| | Labour | Jacqueline Reilly | 380 | 8.5 | +0.9 |
| | Reform UK | Jamie Huntman | 132 | 3.0 | N/A |
| | Liberal Democrats | Richard Bannister | 53 | 1.2 | +0.1 |
| Majority | 679 | 15.2 | +0.4 |
| Turnout | 4,464 | 29.4 | +0.4 |
| | CIIP hold | Swing | 0.2 | |
Canvey Island West | Party | Candidate | Votes | % | ±% |
| | CIIP | Peter May * | 1,832 | 49.8 | ±0.0 |
| | Conservative | Scott Griffin | 1,406 | 38.2 | −1.6 |
| | Labour | David Manclark | 444 | 12.1 | +2.1 |
| Majority | 426 | 11.6 | +1.6 |
| Turnout | 3,682 | 26.4 | +1.8 |
| | CIIP hold | Swing | 0.8 | |
Hadleigh | Party | Candidate | Votes | % | ±% |
| | Conservative | Jillian Reeves * | 2,833 | 50.6 | −15.6 |
| | Independent | Robert Baillie | 1,719 | 30.7 | N/A |
| | Labour | Thomas Harrison | 734 | 13.1 | +1.2 |
| | Liberal Democrats | Geoffrey Duff | 316 | 5.6 | +0.4 |
| Majority | 1,114 | 19.9 | −34.2 |
| Turnout | 5,602 | 39.3 | +6.3 |
| | Conservative hold | Swing | 23.2 | |
South Benfleet | Party | Candidate | Votes | % | ±% |
| | Conservative | Andrew Sheldon * | 2,462 | 48.2 | −16.3 |
| | Independent | Lynsey McCarthy-Calvert | 1,350 | 26.4 | N/A |
| | Labour | Laurence Chapman | 732 | 14.3 | −0.4 |
| | Independent | Christopher Roberts | 422 | 8.3 | N/A |
| | Liberal Democrats | Ellis Swindell | 144 | 2.8 | −1.8 |
| Majority | 1,112 | 21.8 | −26.4 |
| Turnout | 5,110 | 38.0 | +5.4 |
| | Conservative hold | Swing | 21.4 | |
Thundersley | Party | Candidate | Votes | % | ±% |
| | Conservative | Beverley Egan * | 1,984 | 44.9 | −19.7 |
| | Independent | Steven Cole | 1,638 | 37.1 | N/A |
| | Labour | Rosalind Dunhill | 664 | 15.0 | −6.1 |
| | Liberal Democrats | Stephen Tellis | 129 | 2.9 | N/A |
| Majority | 346 | 7.8 | −35.7 |
| Turnout | 4,415 | 35.9 | +5.4 |
| | Conservative hold | Swing | 28.4 | |
Chelmsford
[9]
District Summary
| Party | Seats | +/- | Votes | % | +/- |
| | Conservative | 5 | 1 | 21,384 | 48.2 | +4.2 |
| | Liberal Democrat | 4 | 1 | 12,851 | 29.0 | +3.3 |
| | Labour | 0 | | 4,307 | 9.7 | +0.9 |
| | Green | 0 | | 3,141 | 7.1 | +4.1 |
| | Ind. Network | 0 | | 1,520 | 3.4 | N/A |
| | SWFCTA | 0 | | 979 | 2.2 | N/A |
| | UKIP | 0 | | 113 | 0.3 | −4.6 |
| | Democratic Network | 0 | | 83 | 0.2 | N/A |
Division Results
Broomfield & Writtle | Party | Candidate | Votes | % | ±% |
| | Conservative | Mike Steel | 3,287 | 63.6 | +9.4 |
| | Liberal Democrats | Nikki Perry | 670 | 13.0 | −3.6 |
| | Labour | Lucy Barrett | 653 | 12.6 | +4.7 |
| | Green | Nick Caddick | 560 | 10.8 | +7.8 |
| Majority | 2,617 | 50.6 | +3.8 |
| Turnout | 5,170 | 32.1 | +3.8 |
| | Conservative hold | Swing | 6.5 | |
Chelmer | Party | Candidate | Votes | % | ±% |
| | Conservative | John Spence * | 3,186 | 59.4 | −4.9 |
| | Liberal Democrats | Rose Moore | 1,357 | 25.3 | +10.3 |
| | Labour | David Howell | 443 | 8.3 | −1.3 |
| | Green | Ben Harvey | 376 | 7.0 | +2.2 |
| Majority | 1,829 | 34.1 | −15.1 |
| Turnout | 5,362 | 33.0 | +2.4 |
| | Conservative hold | Swing | 7.6 | |
Chelmsford Central | Party | Candidate | Votes | % | ±% |
| | Liberal Democrats | Marie Goldman | 2,195 | 43.1 | +5.5 |
| | Conservative | Seena Shah | 1,992 | 39.2 | −3.3 |
| | Labour | Edward Massey | 511 | 10.0 | −1.7 |
| | Green | Claire Young | 389 | 7.6 | +3.8 |
| Majority | 203 | 4.4 | — |
| Turnout | 5,189 | 34.1 | +0.8 |
| | Liberal Democrats gain from Conservative | Swing | 4.4 | |
Chelmsford North | Party | Candidate | Votes | % | ±% |
| | Liberal Democrats | Stephen Robinson * | 2,085 | 46.9 | −0.1 |
| | Conservative | Mark Taylor | 1,621 | 36.5 | +1.5 |
| | Labour | Jessica Peacock | 454 | 10.2 | +0.2 |
| | Green | Angela Thomson | 282 | 6.4 | +3.5 |
| Majority | 464 | 10.4 | −1.6 |
| Turnout | 4,442 | 33.6 | −0.7 |
| | Liberal Democrats hold | Swing | 0.8 | |
Chelmsford West | Party | Candidate | Votes | % | ±% |
| | Liberal Democrats | Jude Deakin * | 2,012 | 42.9 | +3.8 |
| | Conservative | Ben McNally | 1,688 | 36.0 | +1.4 |
| | Labour | Pete Dixon | 611 | 13.0 | −3.1 |
| | Green | Ronnie Bartlett | 380 | 8.1 | +5.9 |
| Majority | 324 | 6.9 | +2.4 |
| Turnout | 4,729 | 30.7 | +1.0 |
| | Liberal Democrats hold | Swing | 1.2 | |
Great Baddow | Party | Candidate | Votes | % | ±% |
| | Conservative | Anthony McQuiggan | 2,065 | 38.0 | −8.7 |
| | Liberal Democrats | Smita Rajesh | 1,433 | 26.3 | −8.4 |
| | Ind. Network | Richard Hyland | 1,133 | 20.8 | N/A |
| | Labour | Janbee Mopidevi | 373 | 6.9 | −1.7 |
| | Green | Alex Heard | 324 | 6.0 | +3.2 |
| | UKIP | Jesse Pryke | 113 | 2.1 | −5.2 |
| Majority | 632 | 11.7 | −0.2 |
| Turnout | 5,441 | 35.7 | +4.4 |
| | Conservative hold | Swing | 0.2 | |
South Woodham Ferrers | Party | Candidate | Votes | % | ±% |
| | Conservative | Bob Massey * | 1,936 | 55.7 | +10.0 |
| | SWFCTA | Jill Winn | 979 | 28.2 | +6.7 |
| | Labour | Emmanuel Kemball | 241 | 6.9 | +1.5 |
| | Green | David Rey | 186 | 5.4 | +2.3 |
| | Liberal Democrats | Ian Gale | 132 | 3.8 | −0.4 |
| Majority | 957 | 27.5 | +3.3 |
| Turnout | 3,474 | 28.6 | +1.3 |
| | Conservative hold | Swing | 1.7 | |
Springfield | Party | Candidate | Votes | % | ±% |
| | Liberal Democrats | Mike Mackrory * | 2,630 | 46.0 | −0.1 |
| | Conservative | James Tyrrell | 2,141 | 37.4 | +0.2 |
| | Labour Co-op | Russell Kennedy | 524 | 9.2 | +0.2 |
| | Green | James Lumbard | 340 | 6.0 | +3.6 |
| | Democratic Network | Leah Butler-Smith | 83 | 1.5 | N/A |
| Majority | 489 | 8.6 | −0.2 |
| Turnout | 5,718 | 35.5 | +1.6 |
| | Liberal Democrats hold | Swing | 0.2 | |
Stock | Party | Candidate | Votes | % | ±% |
| | Conservative | Ian Grundy * | 3,468 | 69.5 | +1.2 |
| | Labour | Jake Harvard | 497 | 10.0 | +2.7 |
| | Ind. Network | Paul Clark | 387 | 7.8 | N/A |
| | Liberal Democrats | Tom Willis | 337 | 6.8 | +0.4 |
| | Green | Brian Littlechild | 304 | 6.1 | +2.8 |
| Majority | 2,971 | 59.5 | +6.0 |
| Turnout | 4,993 | 34.2 | +0.4 |
| | Conservative hold | Swing | 0.8 | |
Colchester
District Summary
| Party | Seats | +/- | Votes | % | +/- |
| | Conservative | 5 | 1 | 21,044 | 44.2 | +1.9 |
| | Labour | 2 | 1 | 11,489 | 24.1 | +3.4 |
| | Liberal Democrat | 2 | | 9,831 | 20.6 | −3.6 |
| | Green | 0 | | 4,721 | 9.9 | +4.4 |
| | Reform UK | 0 | | 446 | 0.9 | N/A |
| | Freedom Alliance | 0 | | 89 | 0.2 | N/A |
Division Results
Abbey | Party | Candidate | Votes | % | ±% |
| | Labour | Lee Scordis * | 2,556 | 45.0 | +12.9 |
| | Conservative | Petra Crees | 1,475 | 25.9 | +0.5 |
| | Green | Steph Nissen | 981 | 17.3 | +8.1 |
| | Liberal Democrats | Peter Schraml | 585 | 10.3 | −18.7 |
| | Freedom Alliance | Tim James | 89 | 1.6 | N/A |
| Majority | 1,081 | 19.1 | +16.0 |
| Turnout | 5,686 | 30.6 | +1.4 |
| | Labour hold | Swing | 6.2 | |
Constable | Party | Candidate | Votes | % | ±% |
| | Conservative | Lewis Barber | 3,965 | 67.1 | −1.5 |
| | Labour Co-op | Pauline Bacon | 707 | 12.0 | +1.7 |
| | Green | Roger Bamforth | 613 | 10.4 | +2.7 |
| | Liberal Democrats | William Brown | 491 | 8.3 | −5.2 |
| | Reform UK | Andrew Phillips | 135 | 2.3 | N/A |
| Majority | 3,258 | 55.1 | ±0.0 |
| Turnout | 5,911 | 39.6 | +3.4 |
| | Conservative hold | Swing | 1.6 | |
Drury | Party | Candidate | Votes | % | ±% |
| | Conservative | Sue Lissimore * | 3,328 | 56.1 | −2.1 |
| | Labour | Richard Bourne | 1,263 | 21.3 | +10.8 |
| | Liberal Democrats | Isobel Merry | 802 | 13.5 | −8.9 |
| | Green | Natalie Edgoose | 540 | 9.1 | +3.8 |
| Majority | 2,065 | 34.8 | −1.1 |
| Turnout | 5,933 | 42.0 | +0.9 |
| | Conservative hold | Swing | 6.6 | |
Maypole | Party | Candidate | Votes | % | ±% |
| | Labour | Dave Harris * | 2,187 | 49.8 | −1.7 |
| | Conservative | Chris Piggott | 1,233 | 28.1 | +0.5 |
| | Liberal Democrats | Tony Emment | 666 | 15.2 | +1.0 |
| | Green | Blake Roberts | 215 | 4.9 | +2.6 |
| | Reform UK | Joe Johnson | 92 | 2.1 | N/A |
| Majority | 954 | 21.7 | −2.2 |
| Turnout | 4,393 | 29.0 | +0.7 |
| | Labour hold | Swing | 1.1 | |
Mersea & Tiptree | Party | Candidate | Votes | % | ±% |
| | Conservative | John Jowers * | 3,592 | 71.8 | +22.8 |
| | Green | Peter Banks | 672 | 13.4 | +8.0 |
| | Labour | Usha Agarwal-Hollands | 483 | 9.7 | −0.5 |
| | Liberal Democrats | Susan Waite | 256 | 5.1 | −1.0 |
| Majority | 2,920 | 58.4 | +29.7 |
| Turnout | 5,003 | 34.5 | −1.9 |
| | Conservative hold | Swing | 7.4 | |
Mile End & Highwoods | Party | Candidate | Votes | % | ±% |
| | Liberal Democrats | David King | 2,221 | 39.9 | −6.6 |
| | Conservative | David Linghorn-Baker | 1,856 | 33.3 | −0.9 |
| | Labour | Jocelyn Law | 946 | 17.0 | +6.7 |
| | Green | Amanda Kirke | 387 | 7.0 | +2.4 |
| | Reform UK | Diane Baker | 162 | 2.9 | N/A |
| Majority | 365 | 6.6 | −5.7 |
| Turnout | 5,572 | 32.1 | +2.6 |
| | Liberal Democrats hold | Swing | 2.9 | |
Parsons Heath & East Gates | Party | Candidate | Votes | % | ±% |
| | Conservative | Simon Crow | 1,895 | 41.2 | +7.1 |
| | Liberal Democrats | John Baker * | 1,516 | 33.0 | −10.3 |
| | Labour | Abigail Chambers | 691 | 15.0 | +3.2 |
| | Green | Kemal Cufoglu | 498 | 10.8 | +6.7 |
| Majority | 379 | 8.2 | — |
| Turnout | 4,600 | 35.9 | +1.3 |
| | Conservative gain from Liberal Democrats | Swing | 8.7 | |
Stanway & Pyefleet | Party | Candidate | Votes | % | ±% |
| | Conservative | Kevin Bentley * | 3,004 | 51.1 | −3.8 |
| | Liberal Democrats | Lesley Scott-Boutell | 1,469 | 25.0 | +2.0 |
| | Labour | Michael Lilley | 1,014 | 17.3 | +6.3 |
| | Green | John McArthur | 388 | 6.6 | +1.1 |
| Majority | 1,535 | 26.1 | −5.8 |
| Turnout | 5,875 | 35.7 | ±0.0 |
| | Conservative hold | Swing | 2.9 | |
Wivenhoe St. Andrew | Party | Candidate | Votes | % | ±% |
| | Liberal Democrats | Mark Cory | 1,825 | 39.3 | +14.1 |
| | Labour Co-op | Julie Young * | 1,642 | 35.3 | −12.7 |
| | Conservative | Jodie Clark | 696 | 15.0 | −0.5 |
| | Green | Asa Aldis | 427 | 9.2 | +5.2 |
| | Reform UK | Kevin Blair | 57 | 1.2 | N/A |
| Majority | 183 | 4.0 | — |
| Turnout | 4,647 | 28.4 | −8.2 |
| | Liberal Democrats gain from Labour Co-op | Swing | 13.4 | |
Epping Forest
District Summary
| Party | Seats | +/- | Votes | % | +/- |
| | Conservative | 6 | | 16,764 | 50.7 | −4.4 |
| | Loughton Residents | 1 | | 4,710 | 14.2 | +4.3 |
| | Labour | 0 | | 4,292 | 13.0 | +2.2 |
| | Liberal Democrat | 0 | | 3,901 | 11.8 | −3.8 |
| | Green | 0 | | 2,588 | 7.8 | +2.8 |
| | For Britain | 0 | | 302 | 0.9 | N/A |
| | English Democrats | 0 | | 186 | 0.6 | +0.4 |
| | Reform UK | 0 | | 97 | 0.3 | N/A |
| | TUSC | 0 | | 59 | 0.2 | N/A |
| | Democratic Network | 0 | | 52 | 0.2 | N/A |
| | Young People's | 0 | | 45 | 0.1 | N/A |
Division Results
Buckhurst Hill & Loughton South | Party | Candidate | Votes | % | ±% |
| | Conservative | Marshall Vance | 2,186 | 35.5 | −21.0 |
| | Loughton Residents | Ian Allgood | 1,716 | 27.9 | N/A |
| | Green | Simon Heap | 1,336 | 21.7 | −0.8 |
| | Labour | Inez Collier | 519 | 8.4 | −1.2 |
| | Liberal Democrats | Ish Singh | 256 | 4.2 | −7.2 |
| | Independent | Kevin Horner | 72 | 1.2 | N/A |
| | Young People's | Gerard Wadsworth | 45 | 0.7 | N/A |
| | TUSC | Scott Jones | 23 | 0.4 | N/A |
| Majority | 470 | 7.6 | |
| Turnout | 6,153 | 39.2 | |
| | Conservative hold | Swing | 24.5 | |
Chigwell & Loughton Broadway | Party | Candidate | Votes | % | ±% |
| | Conservative | Lee Scott | 2,686 | 63.3 | −2.4 |
| | Labour | Angela Ayre | 881 | 20.8 | +4.1 |
| | Green | Laura Anderson | 427 | 10.1 | N/A |
| | Liberal Democrats | Stephen Hume | 252 | 5.9 | −11.7 |
| Majority | 1,805 | 42.5 | −5.5 |
| Turnout | 4,246 | 30.8 | +8.4 |
| | Conservative hold | Swing | 3.3 | |
Epping & Theydon Bois | Party | Candidate | Votes | % | ±% |
| | Conservative | Holly Whitbread | 2,909 | 50.1 | +4.5 |
| | Liberal Democrats | Jon Whitehouse | 2,459 | 42.4 | −0.5 |
| | Labour | Simon Bullough | 439 | 7.6 | +0.9 |
| Majority | 450 | 7.7 | +5.0 |
| Turnout | 5,807 | 41.2 | +2.5 |
| | Conservative hold | Swing | 2.5 | |
Loughton Central | Party | Candidate | Votes | % | ±% |
| | Loughton Residents | Chris Pond * | 2,994 | 66.3 | −3.0 |
| | Conservative | Jonathan Hunter | 828 | 18.3 | −1.4 |
| | Labour | Debbie Wild | 552 | 12.2 | +4.1 |
| | Liberal Democrats | Naomi Davies | 145 | 3.2 | +0.2 |
| Majority | 2,166 | 48.0 | −1.7 |
| Turnout | 4,519 | 32.3 | +3.5 |
| | Loughton Residents hold | Swing | 0.8 | |
North Weald & Nazeing | Party | Candidate | Votes | % | ±% |
| | Conservative | Christopher Whitbread * | 2,884 | 72.6 | −6.2 |
| | Labour | Liam Kerrigan | 656 | 16.5 | +3.8 |
| | Liberal Democrats | Elaine Thatcher | 435 | 10.9 | +2.1 |
| Majority | 2,228 | 56.1 | −9.6 |
| Turnout | 3,975 | 28.1 | +0.7 |
| | Conservative hold | Swing | 5.0 | |
Ongar & Rural | Party | Candidate | Votes | % | ±% |
| | Conservative | Jaymey McIvor | 2,723 | 69.6 | +1.4 |
| | Labour | Richard Millwood | 409 | 10.5 | +1.3 |
| | Green | Alan Fricker | 224 | 5.7 | N/A |
| | Liberal Democrats | Edward Barnard | 220 | 5.6 | −7.0 |
| | English Democrat | Robin Tilbrook | 186 | 4.8 | +3.1 |
| | Reform UK | Peter Bell | 97 | 2.5 | N/A |
| | Democratic Network | Paul Stevens | 52 | 1.3 | N/A |
| Majority | 2,314 | 59.1 | +3.5 |
| Turnout | 3,911 | 31.3 | +3.6 |
| | Conservative hold | Swing | 0.5 | |
Waltham Abbey | Party | Candidate | Votes | % | ±% |
| | Conservative | Sam Kane | 2,548 | 57.4 | −2.3 |
| | Labour | Robert Greyson | 836 | 18.9 | +3.5 |
| | Green | Liam Lakes | 581 | 13.1 | +4.6 |
| | For Britain | Julian Leppert | 302 | 6.8 | N/A |
| | Liberal Democrats | Timothy Vaughan | 134 | 3.0 | −1.6 |
| | TUSC | Ian Pattison | 36 | 0.8 | N/A |
| Majority | 1,712 | 38.5 | −5.8 |
| Turnout | 4,437 | 26.9 | +4.1 |
| | Conservative hold | Swing | 2.9 | |
Harlow
| Party | Seats | +/- | Votes | % | +/- |
| | Conservative | 4 | | 15,062 | 54.4 | +3.9 |
| | Labour | 0 | | 9,762 | 35.2 | −5.7 |
| | Harlow Alliance | 0 | | 1,511 | 5.5 | N/A |
| | Liberal Democrat | 0 | | 1,304 | 4.7 | −0.1 |
Division Results
Harlow North | Party | Candidate | Votes | % | ±% |
| | Conservative | Michael Garnett * | 3,289 | 56.9 | +5.9 |
| | Labour Co-op | Kay Morrison | 2,110 | 36.5 | −4.8 |
| | Liberal Democrats | Lesley Rideout | 380 | 6.6 | −1.1 |
| Majority | 1,179 | 20.4 | +10.7 |
| Turnout | 5,779 | 31.2 | +2.1 |
| | Conservative hold | Swing | 5.4 | |
Harlow South East | Party | Candidate | Votes | % | ±% |
| | Conservative | Edward Johnson * | 3,055 | 61.7 | +3.7 |
| | Labour | Mark Ingall | 1,632 | 33.0 | −2.2 |
| | Liberal Democrats | William Tennison | 200 | 4.0 | −2.8 |
| | TUSC | Paul Lenihan | 66 | 1.3 | N/A |
| Majority | 1,423 | 28.7 | +5.8 |
| Turnout | 4,953 | 33.5 | +4.8 |
| | Conservative hold | Swing | 3.0 | |
Harlow West (2 seats) | Party | Candidate | Votes | % | ±% |
| | Conservative | Michael Hardware * | 4,848 | 49.4 | +2.7 |
| | Conservative | Clive Souter * | 3,870 | | |
| | Labour | Daniella Pritchard | 3,255 | 33.2 | −7.8 |
| | Labour | Chris Vince | 2,765 | | |
| | Harlow Alliance | Nicholas Taylor | 764 | 7.8 | N/A |
| | Harlow Alliance | Alan Leverett | 747 | | |
| | Liberal Democrats | Christopher Millington | 378 | 3.9 | +0.4 |
| | Liberal Democrats | Robert Thurston | 346 | | |
| Turnout | 9,807 | 32.6 | +4.3 |
| | Conservative hold |
| | Conservative hold |
Maldon
District Results
| Party | Seats | +/- | Votes | % | +/- |
| | Conservative | 2 | 1 | 8,458 | 47.2 | −6.5 |
| | Independent | 1 | 1 | 4,904 | 27.3 | +17.7 |
| | Liberal Democrat | 0 | | 1,662 | 9.3 | +1.6 |
| | Labour | 0 | | 1,411 | 7.9 | −3.3 |
| | Green | 0 | | 1,267 | 7.1 | +2.4 |
| | UKIP | 0 | | 235 | 1.3 | −8.4 |
Division Results
Heybridge & Tollesbury | Party | Candidate | Votes | % | ±% |
| | Conservative | Mark Durham * | 3,359 | 56.9 | −1.0 |
| | Independent | Carey Martin | 935 | 15.8 | N/A |
| | Labour | Ann Griffin | 618 | 10.5 | −0.2 |
| | Green | Jonathan King | 600 | 10.2 | +4.2 |
| | Liberal Democrats | John Driver | 397 | 6.7 | −1.8 |
| Majority | 2,424 | 41.1 | −6.1 |
| Turnout | 5,909 | 35.6 | +4.1 |
| | Conservative hold | Swing | 8.2 | |
Maldon | Party | Candidate | Votes | % | ±% |
| | Conservative | Jane Fleming | 2,818 | 50.7 | −9.7 |
| | Liberal Democrats | Colin Baldy | 1,126 | 20.2 | +9.0 |
| | Independent | Kevin Lagan | 698 | 12.6 | N/A |
| | Labour | Stephen Capper | 424 | 7.6 | −6.7 |
| | Green | Janet Dine | 356 | 6.4 | +1.2 |
| | Independent | Chrisy Morris | 140 | 2.5 | N/A |
| Majority | 1,692 | 30.5 | −15.5 |
| Turnout | 5,562 | 36.3 | +4.5 |
| | Conservative hold | Swing | 9.4 | |
Southminster | Party | Candidate | Votes | % | ±% |
| | Independent | Wendy Stamp | 3,131 | 48.4 | +22.4 |
| | Conservative | Ron Pratt * | 2,281 | 35.3 | −9.2 |
| | Labour | Jacqueline Brown | 369 | 5.7 | −3.4 |
| | Green | James Taylor | 311 | 4.8 | +1.7 |
| | UKIP | Peter Horscroft | 235 | 3.6 | −9.5 |
| | Liberal Democrats | James Eely | 139 | 2.2 | −2.0 |
| Majority | 850 | 13.1 | — |
| Turnout | 6,466 | 34.1 | +2.4 |
| | Independent gain from Conservative | Swing | 15.8 | |
Rochford
District Summary
| Party | Seats | +/- | Votes | % | +/- |
| | Conservative | 3 | 2 | 10,508 | 45.9 | −0.8 |
| | Liberal Democrat | 1 | 1 | 4,507 | 19.7 | +9.2 |
| | Rochford Residents | 1 | 1 | 4,447 | 19.4 | +12.9 |
| | Labour | 0 | | 2,797 | 12.2 | +1.5 |
| | Independent | 0 | | 645 | 2.8 | +2.0 |
Division Results
Rayleigh North | Party | Candidate | Votes | % | ±% |
| | Liberal Democrats | Craig Cannell | 2,209 | 45.2 | +14.4 |
| | Conservative | Simon Smith | 2,151 | 44.0 | −0.7 |
| | Labour | Steve Cooper | 533 | 10.9 | +3.9 |
| Majority | 58 | 1.2 | — |
| Turnout | 4,893 | 37.5 | +1.3 |
| | Liberal Democrats gain from Conservative | Swing | 7.5 | |
Rayleigh South | Party | Candidate | Votes | % | ±% |
| | Conservative | June Lumley * | 2,160 | 48.4 | −1.8 |
| | Liberal Democrats | James Newport | 1,741 | 39.0 | +27.1 |
| | Labour | Conner Agius | 561 | 12.6 | +4.7 |
| Majority | 419 | 9.4 | −25.1 |
| Turnout | 4,462 | 35.0 | +2.5 |
| | Conservative hold | Swing | 14.5 | |
Rochford North | Party | Candidate | Votes | % | ±% |
| | Conservative | Laureen Shaw | 1,858 | 40.0 | −4.6 |
| | Rochford Resident | Adrian Eves | 1,683 | 36.3 | +3.3 |
| | Independent | George Ioannou | 645 | 13.9 | N/A |
| | Labour | David Flack | 456 | 9.8 | +0.3 |
| Majority | 175 | 3.8 | −18.2 |
| Turnout | 4,686 | 34.5 | +2.7 |
| | Conservative hold | Swing | 4.0 | |
Rochford South | Party | Candidate | Votes | % | ±% |
| | Conservative | Mike Steptoe * | 2,384 | 63.5 | +17.9 |
| | Labour | Penny Richards | 814 | 21.7 | −1.9 |
| | Liberal Democrats | Deborah Taylor | 557 | 14.8 | +10.2 |
| Majority | 1,570 | 41.8 | +19.8 |
| Turnout | 3,755 | 28.3 | −1.4 |
| | Conservative hold | Swing | 9.9 | |
Rochford West | Party | Candidate | Votes | % | ±% |
| | Rochford Resident | Michael Hoy | 2,764 | 53.7 | N/A |
| | Conservative | Carole Weston * | 1,955 | 38.0 | −10.2 |
| | Labour | Ian Rooke | 433 | 8.0 | +0.3 |
| Majority | 809 | 15.7 | +4.2 |
| Turnout | 5,187 | 36.4 | +2.4 |
| | Rochford Resident gain from Conservative | Swing | 31.9 | |
Tendring
District Summary
Division Results
Brightlingsea | Party | Candidate | Votes | % | ±% |
| | Conservative | Alan Goggin * | 2,426 | 44.6 | −2.9 |
| | Independent | Mick Barry | 1,580 | 29.1 | N/A |
| | Liberal Democrats | Gary Scott | 1,056 | 19.4 | −5.4 |
| | Labour | Margaret Saunders | 376 | 6.9 | −5.1 |
| Majority | 846 | 15.5 | −3.3 |
| Turnout | 5,438 | 34.7 | −1.0 |
| | Conservative hold | Swing | 16.0 | |
Clacton East | Party | Candidate | Votes | % | ±% |
| | Independent | Mark Stephenson * | 1,902 | 42.3 | N/A |
| | Conservative | Chris Amos | 1,454 | 32.4 | +1.1 |
| | Holland Residents | K T King | 554 | 12.3 | N/A |
| | Labour | Geoffrey Ely | 300 | 6.7 | −2.7 |
| | Green | Rosie Dodds | 117 | 2.6 | +1.0 |
| | Reform UK | Kate Hammond | 89 | 2.0 | N/A |
| | Liberal Democrats | Mary Pitkin | 76 | 1.7 | −0.1 |
| Majority | 448 | 9.9 | — |
| Turnout | 4,492 | 33.6 | −2.2 |
| | Independent gain from Independent | Swing | 20.6 | |
Clacton North | Party | Candidate | Votes | % | ±% |
| | Conservative | Mike Skeels | 1,404 | 50.6 | +0.7 |
| | Labour | David Bolton | 483 | 17.4 | −4.7 |
| | Tendring First | Gina Placey | 349 | 12.6 | N/A |
| | Independent | Andy Wood * | 262 | 9.4 | N/A |
| | Green | Natasha Osben | 146 | 5.3 | +3.1 |
| | Reform UK | Andrew Pemberton | 130 | 4.7 | N/A |
| Majority | 921 | 33.2 | +5.4 |
| Turnout | 2,774 | 21.5 | −4.2 |
| | Conservative hold | Swing | 2.7 | |
Clacton West | Party | Candidate | Votes | % | ±% |
| | Conservative | Paul Honeywood * | 1,986 | 58.0 | +7.0 |
| | Labour | Sheila Hammond | 518 | 15.1 | −9.8 |
| | Tendring First | Andy White | 370 | 10.8 | N/A |
| | Green | Tracey Osben | 151 | 4.4 | +1.9 |
| | Liberal Democrats | Sean Duffy | 142 | 4.2 | −0.2 |
| | For Britain | Myriam Sohail | 11 | 0.3 | N/A |
| Majority | 1,468 | 42.9 | +16.6 |
| Turnout | 3,423 | 27.1 | −1.4 |
| | Conservative hold | Swing | 8.4 | |
Frinton & Walton | Party | Candidate | Votes | % | ±% |
| | Conservative | Mark Platt * | 3,383 | 55.7 | +3.7 |
| | Tendring First | Terry Allen | 1,310 | 21.6 | −1.0 |
| | Labour | Nic El-Safty | 594 | 9.8 | −0.7 |
| | Green | Susan Clutterbuck | 353 | 5.8 | +2.6 |
| | Independent | Stephen Mayzes | 314 | 5.2 | N/A |
| | Liberal Democrats | Matthew Bensilum | 125 | 2.1 | −0.2 |
| Majority | 2,073 | 34.1 | +4.7 |
| Turnout | 6,079 | 37.5 | −0.6 |
| | Conservative hold | Swing | 2.4 | |
Harwich | Party | Candidate | Votes | % | ±% |
| | Labour | Ivan Henderson * | 2,503 | 56.8 | +5.4 |
| | Conservative | Ricky Callender | 1,683 | 38.2 | +9.1 |
| | Liberal Democrats | Simon Banks | 220 | 5.0 | +2.7 |
| Majority | 820 | 18.6 | −3.1 |
| Turnout | 4,406 | 31.6 | −4.0 |
| | Labour hold | Swing | 1.9 | |
Tendring Rural East | Party | Candidate | Votes | % | ±% |
| | Conservative | Dan Land | 3,334 | 66.3 | +15.2 |
| | Labour | Jo Henderson | 807 | 16.0 | −0.3 |
| | Liberal Democrats | Keith Pitkin | 343 | 6.8 | +0.9 |
| | Green | Chris Southall | 277 | 5.5 | +1.0 |
| | Independent | Danny Mayzes | 203 | 4.0 | N/A |
| | For Britain | Craig Sohail | 67 | 1.3 | N/A |
| Majority | 2,527 | 50.3 | +21.3 |
| Turnout | 5,031 | 32.4 | +0.2 |
| | Conservative hold | Swing | 7.8 | |
Tendring Rural West | Party | Candidate | Votes | % | ±% |
| | Conservative | Carlo Guglielmi * | 2,891 | 55.3 | −4.2 |
| | Liberal Democrats | Terry Barrett | 1,289 | 24.7 | +12.7 |
| | Labour | Maria Fowler | 577 | 11.1 | −1.3 |
| | Green | Beverley Maltby | 373 | 7.1 | −0.4 |
| | Workers Party | Ian Caruana | 94 | 1.8 | N/A |
| Majority | 1,602 | 30.6 | −16.6 |
| Turnout | 5,224 | 35.6 | +2.3 |
| | Conservative hold | Swing | 8.5 | |
Uttlesford
Division Summary
| Party | Seats | +/- | Votes | % | +/- |
| | Conservative | 2 | 2 | 10,525 | 39.5 | −6.1 |
| | Residents for Uttlesford | 2 | 2 | 9,732 | 36.5 | +14.6 |
| | Liberal Democrat | 0 | | 2,838 | 10.7 | −7.2 |
| | Green | 0 | | 1,829 | 6.9 | +3.5 |
| | Labour | 0 | | 1,723 | 6.5 | −0.6 |
Division Results
Dunmow | Party | Candidate | Votes | % | ±% |
| | Conservative | Susan Baker * | 3,534 | 50.7 | −5.2 |
| | R4U | Geoff Bagnall | 2,283 | 32.8 | +8.7 |
| | Labour | Gerard Darcy | 422 | 6.1 | −0.5 |
| | Green | Madeleine Radford | 413 | 5.9 | +3.7 |
| | Liberal Democrats | Lorraine Flawn | 314 | 4.5 | −2.1 |
| Majority | 1,251 | 17.9 | −14.0 |
| Turnout | 6,966 | 34.4 | +3.0 |
| | Conservative hold | Swing | 7.0 | |
Saffron Walden | Party | Candidate | Votes | % | ±% |
| | R4U | Paul Gadd | 3,195 | 43.9 | +12.2 |
| | Conservative | John Moran * | 2,268 | 31.2 | −4.4 |
| | Labour | Andrew Sampson | 636 | 8.8 | −0.2 |
| | Green | Edward Gildea | 627 | 8.6 | +5.1 |
| | Liberal Democrats | Simon Ede | 546 | 7.5 | −10.0 |
| Majority | 927 | 12.7 | — |
| Turnout | 7,272 | 43.2 | +0.7 |
| | R4U gain from Conservative | Swing | 8.3 | |
Stansted | Party | Candidate | Votes | % | ±% |
| | Conservative | Ray Gooding * | 2,547 | 38.0 | +0.6 |
| | R4U | Bianca Donald | 1,984 | 29.6 | +4.2 |
| | Liberal Democrats | Ayub Khan | 1,372 | 20.5 | −7.2 |
| | Green | Debra Gold | 407 | 6.1 | +3.9 |
| | Labour | Samantha Naik | 395 | 5.9 | +1.3 |
| Majority | 563 | 8.4 | −1.4 |
| Turnout | 6,705 | 40.3 | −0.1 |
| | Conservative hold | Swing | 2.4 | |
Thaxted | Party | Candidate | Votes | % | ±% |
| | R4U | Martin Foley | 2,270 | 39.8 | N/A |
| | Conservative | Simon Walsh * | 2,176 | 38.2 | −19.5 |
| | Liberal Democrats | Richard Silcock | 606 | 10.6 | −9.7 |
| | Green | Paul Allington | 382 | 6.7 | +0.2 |
| | Labour | Alex Young | 270 | 4.7 | −3.9 |
| Majority | 94 | 1.6 | — |
| Turnout | 5,704 | 38.8 | +5.2 |
| | R4U gain from Conservative | Swing | 29.7 | |
Maps
Vote share by seat
-
Conservative
-
Labour
-
Liberal Democrats
-
Green
Changes 2021–2025
Rayleigh North by-election, 3 March 2022 | Party | Candidate | Votes | % | ±% |
| | Liberal Democrats | James Newport | 1,658 | 57.4 | |
| | Conservative | Simon Smith | 929 | 32.2 | |
| | Independent | Jack Lawmon | 164 | 5.7 | |
| | Labour | Lorraine Ridley | 137 | 4.7 | |
| Majority | 729 | 25.2 | |
| Turnout | 2,887 | 21.9 | |
| Registered electors | 13,183 | | |
| | Liberal Democrats hold | Swing | | |
Laindon Park & Fryerns by-election, 4 May 2023 | Party | Candidate | Votes | % | ±% |
| | Labour | Patricia Reid | 2,748 | 49.7 | +14.0 |
| | Conservative | Terri Sargent | 1,890 | 34.2 | –8.7 |
| | Green | Oliver McCarthy | 445 | 8.1 | N/A |
| | Liberal Democrats | Mike Chandler | 444 | 8.0 | +3.7 |
| Majority | 858 | 15.5 | N/A |
| Turnout | 5,588 | 18.2 | |
| Registered electors | 30,722 | | |
| | Labour hold | Swing | | |
Harlow South East by-election, 2 May 2024[10] | Party | Candidate | Votes | % | ±% |
| | Conservative | Andrew Johnson | 2,008 | 48.6 | –13.1 |
| | Labour | Kay Morrison | 1,476 | 35.7 | +2.8 |
| | UKIP | Dan Long | 259 | 6.3 | N/A |
| | Green | Jennifer Steadman | 257 | 6.2 | N/A |
| | Liberal Democrats | Christopher Millington | 130 | 3.2 | –0.9 |
| Majority | 532 | 12.9 | |
| Turnout | | 28.1 | –5.4 |
| | Conservative hold | Swing | –7.9 | |
References
- ^ "Election Timetable for England" (PDF). assets.publishing.service.gov.uk. Retrieved 10 October 2020.
- ^ Catherine Johnson (23 April 2018). "Stephen Canning is independent after Conservative suspension". Braintree and Witham Times. Retrieved 16 April 2021.
- ^ "Conservative councillor Andy Wood defects to Lib Dems". Clacton and Frinton Gazette. 3 October 2018. Retrieved 16 April 2021.
- ^ Piers Meyler (19 February 2019). "Braintree councillor quits over fridge grant complaint". Essex Live. Retrieved 16 April 2021.
- ^ Hope Woolston (2 April 2020). "Essex councillor Terry Cutmore dies after testing positive for coronavirus". Essex Live. Retrieved 16 April 2021.
- ^ No by-election was held.
- ^ "Current Vacancy". essex.gov.uk. Archived from the original on 2 December 2021.
- ^ No by-election was held as the resignation was sufficiently close to the upcoming County election.
- ^ "ECC election results 2021". chelmsford.gov.uk. Retrieved 15 August 2021.
- ^ "Election Division Candidates". essex.gov.uk. Essex County Council. Retrieved 24 April 2024.

 2.1%)
2.1%)

 4
4 
 Conservative
 Labour
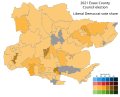 Liberal Democrats
 Green
Green


 Council elections in Essex


