Timeline of the 1993 Atlantic hurricane season
| Timeline of the 1993 Atlantic hurricane season | |||||||
|---|---|---|---|---|---|---|---|
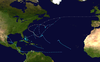
 Season summary map | |||||||
| Season boundaries | |||||||
| First system formed | May 31, 1993 | ||||||
| Last system dissipated | September 30, 1993 | ||||||
| Strongest system | |||||||
| Name | Emily | ||||||
| Maximum winds | 115 mph (185 km/h) (1-minute sustained) | ||||||
| Lowest pressure | 960 mbar (hPa; 28.35 inHg) | ||||||
| Longest lasting system | |||||||
| Name | Emily | ||||||
| Duration | 14.75 days | ||||||
| |||||||
| Other years 1991, 1992, 1993, 1994, 1995 | |||||||
The 1993 Atlantic hurricane season consisted of the events that occurred in the annual cycle of tropical cyclone formation over the Atlantic Ocean north of the Equator. The official bounds of each Atlantic hurricane season are dates that conventionally delineate the period each year during which tropical cyclones tend to form in the basin according to the National Hurricane Center, beginning on June 1 and ending on November 30.[1] However, tropical cyclogenesis is possible at any time of the year, as evidenced by the development of Tropical Depression One on May 31,[2] one day before the official start of the season. By contrast, the dissipation of Tropical Depression Ten on September 30 effectively concluded the season two months before it officially ended.[1][3] September 21 was the final date on which a system of at least tropical storm strength was active; this was described in a 1995 retrospective from Monthly Weather Review as the earliest such occurrence since 1930.[nb 1][5]: 871 Seasonal activity was below average – of the season's 10 tropical depressions, eight strengthened further to become named tropical storms and four became hurricanes, compared to contemporary long-term averages of 10 tropical storms and six hurricanes, and modern averages of 14 tropical storms and seven hurricanes.[1][5]: 871 Hurricane Emily was the only Atlantic major hurricane in 1993;[nb 2] this is slightly below the contemporary average of two major hurricanes per season, while modern seasons produce three on average.[1][6]
The two most impactful systems of the season were Tropical Storm Bret and Hurricane Gert; more than 300 people were killed by the combined effects of both storms. Bret became a catastrophic storm for Venezuela after extreme rainfall triggered widespread flooding and mudslides in the Caracas area, causing significant impacts in Nicaragua as well; the latter country would suffer renewed flooding from Gert just over a month later. After hitting Nicaragua, Gert—a sprawling and moisture-laden tropical cyclone—generated heavy rainfall over a large portion of Central America and Mexico.[5]: 877, 883, 885 [7][8] Several other tropical cyclones caused extensive flooding during the season. Tropical Depression One and the precursor to Tropical Storm Arlene each killed 20 people, the former in Cuba and Haiti,[2][9] and the latter due to a single mudslide in El Salvador. After becoming a tropical cyclone, Arlene caused considerable flood damage in South Texas and northeastern Mexico.[10] In August, Tropical Storm Cindy produced more than a foot (12 in; 30.48 cm) of rain in Martinique.[11] At the end of the month, the western eyewall of Hurricane Emily passed over the Outer Banks of North Carolina while the storm was near its peak intensity; powerful winds and record-breaking floods caused three fatalities and heavy but localized damage.[5]: 871, 881
By convention, meteorologists use one time zone, Coordinated Universal Time (UTC), when issuing forecasts and making observations; they also use the 24-hour clock, where 00:00 = midnight UTC.[12] The National Hurricane Center uses both UTC and the time zone where the center of the tropical cyclone is presently located. Prior to 2020, three time zones were utilized in forecast products for Atlantic tropical cyclones: Atlantic, Eastern, and Central, from east to west.[13]
In this timeline, all information is listed by UTC first, with the respective regional time zone included in parentheses. Additionally, figures for maximum sustained winds and position estimates are rounded to the nearest five units (knots, miles, or kilometers) and averaged over one minute, following National Hurricane Center practice. Direct wind observations are rounded to the nearest whole number. Atmospheric pressures are listed to the nearest millibar and nearest hundredth of an inch of mercury. This timeline documents tropical cyclone formations, strengthening, weakening, landfalls, extratropical transitions, and dissipations during the season. It includes information that was not released throughout the season, meaning that data from post-storm reviews by the National Hurricane Center has been included.
Timeline of events

May
May 31

- 12:00 UTC (8:00 a.m. EDT) at 21°30′N 84°00′W / 21.5°N 84.0°W / 21.5; -84.0 (Tropical Depression One develops.) – Tropical Depression One forms from an interaction between a tropical wave and a monsoonal gyre about 60 mi (95 km) west of the Isle of Youth. Later in the day, the system traverses central Cuba.[2][14]
June
June 1
- The 1993 Atlantic hurricane season officially begins.[1]
- 00:00 UTC (8:00 p.m. EDT, May 31) at 23°12′N 80°18′W / 23.2°N 80.3°W / 23.2; -80.3 (One emerges over the Straits of Florida.) – Tropical Depression One emerges over the Straits of Florida about 65 mi (100 km) east of Varadero, Cuba.[2][14]
- 12:00 UTC (8:00 a.m. EDT) at 25°24′N 77°30′W / 25.4°N 77.5°W / 25.4; -77.5 (One reaches its peak intensity.) – Tropical Depression One reaches maximum sustained winds of 35 mph (55 km/h) and a minimum barometric pressure of 999 mbar (29.50 inHg) about 290 mi (465 km) northeast of Varadero, Cuba.[2][14]
June 2
- 12:00 UTC (8:00 a.m. EDT) at 28°24′N 69°54′W / 28.4°N 69.9°W / 28.4; -69.9 (One becomes extratropical.) – Tropical Depression One transitions into an extratropical cyclone, strengthening to gale force as it does so, about 795 mi (1,280 km) east-northeast of Varadero, Cuba.[2][14]
June 18
- 00:00 UTC (7:00 p.m. CDT, June 17) at 20°30′N 91°54′W / 20.5°N 91.9°W / 20.5; -91.9 (Tropical Depression Two develops.) – Tropical Depression Two forms from an area of disturbed weather over the Bay of Campeche.[15][16]
June 19

- 12:00 UTC (7:00 a.m. CDT) at 25°54′N 95°54′W / 25.9°N 95.9°W / 25.9; -95.9 (Two develops a new center and becomes Tropical Storm Arlene, reaching its peak intensity.) – Tropical Depression Two develops a new center of circulation as the old center dissipates about 115 mi (185 km) to the southeast. The overall system strengthens into Tropical Storm Arlene about 155 mi (250 km) southeast of Corpus Christi, Texas; it simultaneously reaches maximum sustained winds of 40 mph (65 km/h) and a minimum barometric pressure of 1,000 mbar (29.53 inHg).[16][17]
June 20
- 09:00 UTC (4:00 a.m. CDT) at 27°06′N 97°24′W / 27.1°N 97.4°W / 27.1; -97.4 (Arlene makes landfall.) – Tropical Storm Arlene makes landfall over Padre Island, Texas, with sustained winds of 40 mph (65 km/h) and a barometric pressure of 1,001 mbar (29.56 inHg).[16][17]
- 12:00 UTC (7:00 a.m. CDT) at 27°12′N 97°48′W / 27.2°N 97.8°W / 27.2; -97.8 (Arlene weakens into a tropical depression.) – Tropical Storm Arlene weakens into a tropical depression about 45 mi (75 km) southwest of Corpus Christi, Texas.[16][17]
June 21
- 06:00 UTC (1:00 a.m. CDT) at 27°06′N 98°18′W / 27.1°N 98.3°W / 27.1; -98.3 (Arlene degenerates into a remnant low.) – Tropical Depression Arlene is last noted as a tropical cyclone about 70 mi (110 km) southwest of Corpus Christi, Texas; it degenerates into a remnant low six hours later.[16][17]
July
- No tropical cyclones were active in July.
August
August 4

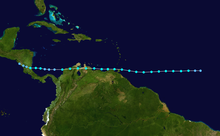
- 12:00 UTC (8:00 a.m. AST) at 10°24′N 40°18′W / 10.4°N 40.3°W / 10.4; -40.3 (A tropical depression develops.) – A tropical depression forms from a tropical wave about 1,115 mi (1,855 km) west-southwest of Cape Verde.[18][19]
August 5
- 00:00 UTC (8:00 p.m. AST, August 4) at 10°24′N 43°24′W / 10.4°N 43.4°W / 10.4; -43.4 (The tropical depression becomes Tropical Storm Bret.) – The tropical depression strengthens into Tropical Storm Bret about 1,215 mi (1,955 km) east of Trinidad.[18][19]
August 6
- 06:00 UTC (2:00 a.m. AST) at 10°06′N 52°54′W / 10.1°N 52.9°W / 10.1; -52.9 (Bret reaches its peak winds.) – Tropical Storm Bret reaches maximum sustained winds of 60 mph (95 km/h) about 570 mi (915 km) east of Trinidad.[18][19]
August 7
- 00:00 UTC (8:00 p.m. AST, August 6) at 10°24′N 58°36′W / 10.4°N 58.6°W / 10.4; -58.6 (Bret reaches its lowest pressure.) – Tropical Storm Bret reaches a minimum barometric pressure of 1,002 mbar (29.59 inHg) about 185 mi (295 km) east of Trinidad.[18][19]
- 07:00 UTC (3:00 a.m. AST) at 10°48′N 60°48′W / 10.8°N 60.8°W / 10.8; -60.8 (Bret makes landfall on Trinidad.) – Tropical Storm Bret makes landfall near Galera Point in northern Trinidad with sustained winds of 60 mph (95 km/h) and a barometric pressure of 1,002 mbar (29.59 inHg).[18][19]
- 10:00 UTC (6:00 a.m. AST) at 10°48′N 61°48′W / 10.8°N 61.8°W / 10.8; -61.8 (Bret makes its first Venezuelan landfall.) – Tropical Storm Bret makes landfall near Macuro, Venezuela, with sustained winds of 60 mph (95 km/h) and a barometric pressure of 1,002 mbar (29.59 inHg). It reemerges over water ten hours later, remaining close to the northern coast of Venezuela.[18][19]
August 8
- 08:00 UTC (4:00 a.m. EDT) at 11°00′N 68°18′W / 11.0°N 68.3°W / 11.0; -68.3 (Bret makes its second Venezuelan landfall.) – Tropical Storm Bret makes landfall near Chichiriviche, Venezuela, with sustained winds of 45 mph (75 km/h) and a barometric pressure of 1,007 mbar (29.74 inHg).[18][19][20]
August 9
- 06:00 UTC (2:00 a.m. EDT) at 10°42′N 75°48′W / 10.7°N 75.8°W / 10.7; -75.8 (Bret emerges over the southwestern Caribbean Sea.) – Tropical Storm Bret emerges over the southwestern Caribbean Sea.[19][20]
- 12:00 UTC (8:00 a.m. EDT) at 10°42′N 77°48′W / 10.7°N 77.8°W / 10.7; -77.8 (Bret weakens into a tropical depression.) – Tropical Storm Bret weakens into a tropical depression about 410 mi (660 km) east of Punta Gorda, Nicaragua.[19][20]
August 10
- 06:00 UTC (2:00 a.m. EDT) at 11°00′N 81°24′W / 11.0°N 81.4°W / 11.0; -81.4 (Bret regains tropical storm status.) – Tropical Depression Bret restrengthens into a tropical storm about 165 mi (270 km) east of Punta Gorda, Nicaragua.[19][20]
- 12:00 UTC (7:00 a.m. CDT) at 11°06′N 82°36′W / 11.1°N 82.6°W / 11.1; -82.6 (Bret reaches its secondary peak intensity.) – Tropical Storm Bret reaches its secondary peak intensity about 85 mi (140 km) east-southeast of Punta Gorda, Nicaragua, with sustained winds of 45 mph (75 km/h) and a barometric pressure of 1,002 mbar (29.59 inHg).[19][20]
- 17:00 UTC (12:00 p.m. CDT) at 11°06′N 83°48′W / 11.1°N 83.8°W / 11.1; -83.8 (Bret makes landfall in Nicaragua.) – Tropical Storm Bret makes landfall about 30 mi (45 km) south of Punta Gorda, Nicaragua, at its secondary peak intensity.[19][20]
August 11
- 00:00 UTC (7:00 p.m. CDT, August 10) at 11°24′N 85°00′W / 11.4°N 85.0°W / 11.4; -85.0 (Bret weakens back into a tropical depression.) – Tropical Storm Bret weakens back into a tropical depression inland about 80 mi (130 km) west of Punta Gorda, Nicaragua.[19][20]
- 12:00 UTC (7:00 a.m. CDT) at 12°12′N 86°48′W / 12.2°N 86.8°W / 12.2; -86.8 (Bret dissipates.) – Tropical Depression Bret is last noted as a tropical cyclone about 205 mi (335 km) west-northwest of Punta Gorda, Nicaragua; it dissipates six hours later while located just inland from the Pacific coast of Nicaragua.[nb 3][19][20]
August 14
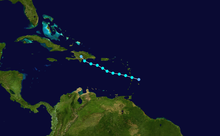
- 12:00 UTC (8:00 a.m. AST) at 14°06′N 59°30′W / 14.1°N 59.5°W / 14.1; -59.5 (A tropical depression develops.) – A tropical depression forms from a tropical wave about 110 mi (175 km) east-southeast of Martinique.[23][24]
- 18:00 UTC (2:00 p.m. AST) at 14°30′N 60°54′W / 14.5°N 60.9°W / 14.5; -60.9 (The tropical depression becomes Tropical Storm Cindy and makes landfall on Martinique.) – The tropical depression strengthens into Tropical Storm Cindy as it makes landfall on Martinique with sustained winds of 40 mph (65 km/h) and a barometric pressure of 1,012 mbar (29.88 inHg).[23][24]
August 16
- 12:00 UTC (8:00 a.m. AST) at 17°18′N 69°18′W / 17.3°N 69.3°W / 17.3; -69.3 (Cindy reaches its peak intensity.) – Tropical Storm Cindy reaches maximum sustained winds of 45 mph (75 km/h) and a minimum barometric pressure of 1,007 mbar (29.74 inHg) about 85 mi (140 km) southeast of Santo Domingo, Dominican Republic.[23][24]
- 21:00 UTC (5:00 p.m. AST) at 18°18′N 71°00′W / 18.3°N 71.0°W / 18.3; -71.0 (Cindy weakens into a tropical depression and makes landfall in the Dominican Republic.) – Tropical Storm Cindy weakens into a tropical depression as it makes landfall near Barahona, Dominican Republic, with sustained winds of 35 mph (55 km/h) and a barometric pressure of 1,009 mbar (29.80 inHg).[23][24]
August 17
- 00:00 UTC (8:00 p.m. AST, August 16) at 18°48′N 71°18′W / 18.8°N 71.3°W / 18.8; -71.3 (Cindy dissipates.) – Tropical Depression Cindy is last noted as a tropical cyclone inland about 45 mi north-northwest of Barahona, Dominican Republic; it dissipates shortly thereafter.[23][24]
August 22
- 18:00 UTC (2:00 p.m. AST) at 19°54′N 52°36′W / 19.9°N 52.6°W / 19.9; -52.6 (A tropical depression develops.) – A tropical depression forms from a tropical wave about 915 mi (1,475 km) east-northeast of Puerto Rico.[25][26]
August 23
- 12:00 UTC (8:00 a.m. AST) at 13°36′N 30°48′W / 13.6°N 30.8°W / 13.6; -30.8 (Another tropical depression develops.) – Another tropical depression forms from an area of disturbed weather well to the west of the coast of Africa.[27][28]
August 24
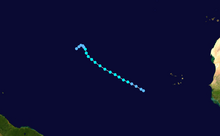
- 12:00 UTC (8:00 a.m. AST) at 15°24′N 34°00′W / 15.4°N 34.0°W / 15.4; -34.0 (The tropical depression west of Africa becomes Tropical Storm Dennis.) – The tropical depression west of Africa strengthens into Tropical Storm Dennis.[27][28]
August 25
- 06:00 UTC (2:00 a.m. AST) at 16°54′N 36°36′W / 16.9°N 36.6°W / 16.9; -36.6 (Dennis reaches its peak intensity.) – Tropical Storm Dennis reaches maximum sustained winds of 50 mph (85 km/h) and a minimum barometric pressure of 1,000 mbar (29.53 inHg).[27][28]
- 12:00 UTC (8:00 a.m. AST) at 28°00′N 60°24′W / 28.0°N 60.4°W / 28.0; -60.4 (The earlier-forming tropical depression becomes Tropical Storm Emily.) – The tropical depression that had formed far to the east-northeast of Puerto Rico three days prior strengthens into Tropical Storm Emily about 775 mi (1,250 km) north-northeast of that island.[25][26]
August 26
- 18:00 UTC (2:00 p.m. AST) at 26°54′N 61°42′W / 26.9°N 61.7°W / 26.9; -61.7 (Emily reaches Category 1 status.) – Tropical Storm Emily strengthens into a Category 1 hurricane about 675 mi (1,085 km) north-northeast of Puerto Rico. The system's sustained winds simultaneously reach an initial peak of 75 mph (120 km/h); its barometric pressure is 1,004 mbar (29.65 inHg) at this time.[25][26]
August 27

- 00:00 UTC (8:00 p.m. AST, August 26) at 26°36′N 62°24′W / 26.6°N 62.4°W / 26.6; -62.4 (Emily weakens into a tropical storm.) – Hurricane Emily weakens into a tropical storm about 640 mi (1,030 km) north-northeast of Puerto Rico, though the system's barometric pressure decreases to 1,000 mbar (29.53 inHg) and continues to drop over the next 48 hours.[25][26]
- 12:00 UTC (8:00 a.m. AST) at 22°30′N 43°00′W / 22.5°N 43.0°W / 22.5; -43.0 (Dennis weakens into a tropical depression.) – Tropical Storm Dennis weakens into a tropical depression.[27][28]
- 18:00 UTC (2:00 p.m. AST) at 26°24′N 64°24′W / 26.4°N 64.4°W / 26.4; -64.4 (Emily regains Category 1 status.) – Tropical Storm Emily restrengthens into a Category 1 hurricane about 580 mi (935 km) north-northeast of Puerto Rico.[25][26]
August 28
- 12:00 UTC (8:00 a.m. AST) at 22°12′N 44°30′W / 22.2°N 44.5°W / 22.2; -44.5 (Dennis dissipates.) – Tropical Depression Dennis dissipates.[27][28]
August 29
- 00:00 UTC (8:00 p.m. EDT, August 28) at 28°36′N 68°12′W / 28.6°N 68.2°W / 28.6; -68.2 (Emily reaches its initial pressure minimum.) – The barometric pressure of Hurricane Emily reaches an initial minimum of 973 mbar (28.73 inHg) about 625 mi (1,010 km) southeast of Cape Hatteras, North Carolina.[26]
August 31
- 06:00 UTC (2:00 a.m. EDT) at 32°54′N 73°48′W / 32.9°N 73.8°W / 32.9; -73.8 (Emily reaches Category 2 status.) – Hurricane Emily strengthens to Category 2 intensity about 190 mi (305 km) south-southeast of Cape Hatteras, North Carolina.[26]
- 18:00 UTC (2:00 p.m. EDT) at 34°30′N 75°12′W / 34.5°N 75.2°W / 34.5; -75.2 (Emily reaches Category 3 status and its peak winds.) – Hurricane Emily strengthens to Category 3 intensity about 50 mi (85 km) south-southeast of Cape Hatteras, North Carolina, making it the only major hurricane of the season; it simultaneously reaches maximum sustained winds of 115 mph (185 km/h).[25][26]
- 21:00 UTC (5:00 p.m. EDT) at 35°12′N 75°06′W / 35.2°N 75.1°W / 35.2; -75.1 (Emily makes its closest approach to North Carolina.) – Hurricane Emily makes its closest approach to Cape Hatteras, North Carolina, passing about 25 mi (35 km) to the east with sustained winds of 115 mph (185 km/h) and a barometric pressure of 961 mbar (28.38 inHg).[25][29]
September
September 1
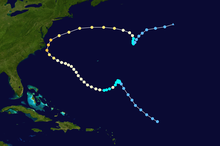
- 00:00 UTC (8:00 p.m. EDT, August 31) at 35°36′N 74°54′W / 35.6°N 74.9°W / 35.6; -74.9 (Emily reaches its lowest pressure.) – Hurricane Emily reaches a minimum barometric pressure of 960 mbar (28.35 inHg) about 45 mi (75 km) northeast of Cape Hatteras, North Carolina.[25][26][29]
- 12:00 UTC (8:00 a.m. EDT) at 37°30′N 72°42′W / 37.5°N 72.7°W / 37.5; -72.7 (Emily weakens to Category 2 status.) – Hurricane Emily weakens to Category 2 intensity about 225 mi (360 km) northeast of Cape Hatteras, North Carolina.[26]
September 3
- 00:00 UTC (8:00 p.m. AST, September 2) at 38°36′N 59°36′W / 38.6°N 59.6°W / 38.6; -59.6 (Emily weakens to Category 1 status.) – Hurricane Emily weakens to Category 1 intensity about 910 mi (1,465 km) east-northeast of Cape Hatteras, North Carolina.[26]
- 18:00 UTC (2:00 p.m. AST) at 36°54′N 57°30′W / 36.9°N 57.5°W / 36.9; -57.5 (Emily weakens into a tropical storm.) – Hurricane Emily weakens into a tropical storm about 1,015 mi (1,630 km) east of Cape Hatteras, North Carolina.[29][30]
September 4
- 18:00 UTC (2:00 p.m. AST) at 36°06′N 57°12′W / 36.1°N 57.2°W / 36.1; -57.2 (Emily weakens into a tropical depression.) – Tropical Storm Emily weakens into a tropical depression about 1,030 mi (1,660 km) east of Cape Hatteras, North Carolina.[29][30]
September 6
- 12:00 UTC (8:00 a.m. AST) at 39°48′N 49°24′W / 39.8°N 49.4°W / 39.8; -49.4 (Emily becomes extratropical.) – Tropical Depression Emily transitions into an extratropical cyclone about 1,460 mi (2,355 km) east-northeast of Cape Hatteras, North Carolina.[29][30]
September 7

- 12:00 UTC (8:00 a.m. EDT) at 24°42′N 67°30′W / 24.7°N 67.5°W / 24.7; -67.5 (A tropical depression develops.) – A tropical depression forms from a tropical wave about 485 mi (780 km) north-northwest of the Virgin Islands.[31][32]
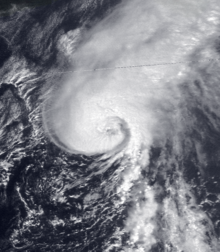
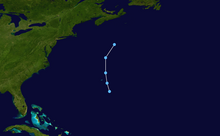
- 18:00 UTC (2:00 p.m. EDT) at 26°12′N 68°12′W / 26.2°N 68.2°W / 26.2; -68.2 (The tropical depression becomes Tropical Storm Floyd.) – The tropical depression strengthens into Tropical Storm Floyd about 470 mi (760 km) south-southwest of Bermuda.[31][32]
September 8
- 00:00 UTC (8:00 p.m. EDT, September 7) at 27°48′N 68°54′W / 27.8°N 68.9°W / 27.8; -68.9 (Floyd reaches its initial peak intensity.) – Tropical Storm Floyd reaches its initial peak intensity with sustained winds of 50 mph (85 km/h) and a barometric pressure of 1,009 mbar (29.80 inHg).[31][32]
September 9
- 18:00 UTC (2:00 p.m. AST) at 41°42′N 58°18′W / 41.7°N 58.3°W / 41.7; -58.3 (Floyd reaches Category 1 status and its peak intensity.) – Tropical Storm Floyd strengthens into a Category 1 hurricane about 735 mi (1,185 km) north-northeast of Bermuda; it simultaneously reaches its peak intensity as a tropical cyclone, with maximum sustained winds of 75 mph (120 km/h) and a minimum barometric pressure of 990 mbar (29.23 inHg).[32][33]
September 10
- 18:00 UTC (2:00 p.m. AST) at 47°18′N 37°48′W / 47.3°N 37.8°W / 47.3; -37.8 (Floyd becomes extratropical.) – Hurricane Floyd transitions into an extratropical cyclone about 1,750 mi (2,815 km) northeast of Bermuda.[32][33]
September 14
- 18:00 UTC (2:00 p.m. EDT) at 10°36′N 80°42′W / 10.6°N 80.7°W / 10.6; -80.7 (A tropical depression develops.) – A tropical depression forms from a tropical wave about 105 mi (165 km) north of the Caribbean coast of Panama.[34][35]
September 15
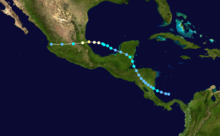
- 12:00 UTC (7:00 a.m. CDT) at 11°18′N 83°00′W / 11.3°N 83.0°W / 11.3; -83.0 (The tropical depression becomes Tropical Storm Gert.) – The tropical depression strengthens into Tropical Storm Gert about 70 mi (110 km) southeast of Bluefields, Nicaragua.[34][35]
- 18:00 UTC (1:00 p.m. CDT) at 11°48′N 83°48′W / 11.8°N 83.8°W / 11.8; -83.8 (Gert makes landfall near Bluefields.) – Tropical Storm Gert makes landfall near Bluefields, Nicaragua, with sustained winds of 40 mph (65 km/h) and a barometric pressure of 1,005 mbar (29.68 inHg).[34][35]
September 16
- 00:00 UTC (7:00 p.m. CDT, September 15) at 12°06′N 84°18′W / 12.1°N 84.3°W / 12.1; -84.3 (Gert weakens into a tropical depression.) – Tropical Storm Gert weakens into a tropical depression inland about 40 mi (65 km) west of Bluefields, Nicaragua.[34][35]
September 17
- Just after 12:00 UTC (7:00 a.m. CDT) at 15°24′N 87°18′W / 15.4°N 87.3°W / 15.4; -87.3 (Gert emerges over the Gulf of Honduras.) – Tropical Depression Gert emerges over the Gulf of Honduras.[35][36]
- 18:00 UTC (1:00 p.m. CDT) at 16°18′N 87°48′W / 16.3°N 87.8°W / 16.3; -87.8 (Gert regains tropical storm status.) – Tropical Depression Gert restrengthens into a tropical storm about 85 mi (140 km) south-southeast of Belize City, Belize.[35][36]
September 18
- 00:00 UTC (7:00 p.m. CDT, September 17) at 17°18′N 88°06′W / 17.3°N 88.1°W / 17.3; -88.1 (Gert makes landfall near Belize City.) – Tropical Storm Gert makes landfall near Belize City, Belize, with sustained winds of 40 mph and a barometric pressure of 1,000 mbar (29.53 inHg).[35][36]
- 12:00 UTC (7:00 a.m. CDT) at 18°42′N 89°18′W / 18.7°N 89.3°W / 18.7; -89.3 (Gert weakens back into a tropical depression.) – Tropical Storm Gert weakens into a tropical depression inland over the Yucatán Peninsula.[35][36]
- 18:00 UTC (2:00 p.m. AST) at 26°42′N 61°48′W / 26.7°N 61.8°W / 26.7; -61.8 (A tropical depression develops.) – A tropical depression forms from an interaction between a tropical wave and an upper-level low pressure area about 425 mi (685 km) south-southeast of Bermuda.[37][38]
- Just after 18:00 UTC (1:00 p.m. CDT) at 19°12′N 90°30′W / 19.2°N 90.5°W / 19.2; -90.5 (Gert emerges over the Bay of Campeche.) – Tropical Depression Gert emerges over the Bay of Campeche.[35][36]
September 19
- 06:00 UTC (1:00 a.m. CDT) at 20°00′N 92°30′W / 20.0°N 92.5°W / 20.0; -92.5 (Gert regains tropical storm status again.) – Tropical Depression Gert restrengthens into a tropical storm about 320 mi (520 km) east of Tuxpan, Veracruz.[35][36]
September 20
- 06:00 UTC (1:00 a.m. CDT) at 21°06′N 95°00′W / 21.1°N 95.0°W / 21.1; -95.0 (Gert reaches Category 1 status.) – Tropical Storm Gert strengthens into a Category 1 hurricane about 155 mi (250 km) east of Tuxpan, Veracruz.[35][36]
- 06:00 UTC (2:00 a.m. AST) at 31°30′N 59°00′W / 31.5°N 59.0°W / 31.5; -59.0 (The tropical depression becomes Tropical Storm Harvey.) – The tropical depression that had formed well to the south-southeast of Bermuda 36 hours prior strengthens into Tropical Storm Harvey about 340 mi (545 km) east of the archipelago.[37][38]
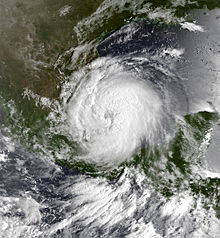
- 18:00 UTC (1:00 p.m. CDT) at 21°18′N 97°00′W / 21.3°N 97.0°W / 21.3; -97.0 (Gert reaches Category 2 status and its peak intensity.) – Hurricane Gert strengthens to Category 2 intensity about 35 mi (55 km) northeast of Tuxpan, Veracruz; it simultaneously reaches maximum sustained winds of 100 mph (155 km/h) and a minimum barometric pressure of 970 mbar (28.64 inHg).[35][36]
- 18:00 UTC (2:00 p.m. AST) at 35°36′N 55°12′W / 35.6°N 55.2°W / 35.6; -55.2 (Harvey reaches Category 1 status and its peak intensity.) – Tropical Storm Harvey strengthens into a Category 1 hurricane about 595 mi (955 km) east-northeast of Bermuda; it simultaneously reaches maximum sustained winds of 75 mph (120 km/h) and a minimum barometric pressure of 990 mbar (29.23 inHg).[37][38]
- 21:00 UTC (4:00 p.m. CDT) at 21°12′N 97°30′W / 21.2°N 97.5°W / 21.2; -97.5 (Gert makes landfall near Tuxpan.) – Hurricane Gert makes landfall near Tuxpan, Veracruz, at its peak intensity.[35][36]
September 21
- 00:00 UTC (7:00 p.m. CDT, September 20) at 21°06′N 98°18′W / 21.1°N 98.3°W / 21.1; -98.3 (Gert weakens to Category 1 status.) – Hurricane Gert weakens to Category 1 intensity inland about 60 mi (95 km) west of Tuxpan, Veracruz.[35][36]
- 00:00 UTC (8:00 p.m. AST, September 20) at 37°48′N 52°30′W / 37.8°N 52.5°W / 37.8; -52.5 (Harvey weakens into a tropical storm.) – Hurricane Harvey weakens into a tropical storm about 790 mi (1,270 km) east-northeast of Bermuda.[37][38]
- 06:00 UTC (1:00 a.m. CDT) at 20°54′N 100°12′W / 20.9°N 100.2°W / 20.9; -100.2 (Gert weakens into a tropical storm.) – Hurricane Gert weakens into a tropical storm inland about 180 mi (285 km) west of Tuxpan, Veracruz.[35][36]
- 12:00 UTC (7:00 a.m. CDT) at 20°48′N 102°30′W / 20.8°N 102.5°W / 20.8; -102.5 (Gert weakens into a tropical depression for the final time.) – Tropical Storm Gert weakens into a tropical depression inland about 330 mi (530 km) west of Tuxpan, Veracruz.[35][36]
- 18:00 UTC (1:00 p.m. CDT) at 20°48′N 104°42′W / 20.8°N 104.7°W / 20.8; -104.7 (Gert is redesignated as Tropical Depression Fourteen-E.) – Tropical Depression Gert is redesignated as Tropical Depression Fourteen-E as it approaches the Pacific coast of Mexico; it crosses into the Eastern Pacific basin shortly thereafter.[35][36][39]
- 18:00 UTC (2:00 p.m. AST) at 46°00′N 42°00′W / 46.0°N 42.0°W / 46.0; -42.0 (Harvey becomes extratropical.) – Tropical Storm Harvey transitions into an extratropical cyclone about 1,530 mi (2,465 km) northeast of Bermuda.[37][38]
September 29
- 18:00 UTC (2:00 p.m. AST) at 30°00′N 63°12′W / 30.0°N 63.2°W / 30.0; -63.2 (Tropical Depression Ten develops and reaches its peak winds.) – Tropical Depression Ten forms about 185 mi (295 km) south-southeast of Bermuda; it simultaneously reaches peak winds of 35 mph (55 km/h).[3]
September 30
- 12:00 UTC (8:00 a.m. AST) at 36°54′N 64°00′W / 36.9°N 64.0°W / 36.9; -64.0 (Ten reaches its lowest pressure.) – Tropical Depression Ten reaches a minimum barometric pressure of 1,008 mbar (29.77 inHg) about 315 mi (510 km) north of Bermuda.[3]
- 18:00 UTC (2:00 p.m. AST) at 39°36′N 62°12′W / 39.6°N 62.2°W / 39.6; -62.2 (Ten dissipates.) – Tropical Depression Ten is last noted as a tropical cyclone about 525 mi (845 km) north-northeast of Bermuda; it merges with a cold front six hours later, marking its dissipation.[3]
October
- No tropical cyclones were active in October.
November
- No tropical cyclones were active in November.
November 30
- The 1993 Atlantic hurricane season officially ends.[1]
Notes
- ^ At the time, the 1930 Atlantic hurricane season was believed to have ended with the dissipation of the 1930 San Zenón hurricane on September 17. In 2010, as part of the ongoing Atlantic hurricane reanalysis project, an October tropical storm was discovered and added to the Atlantic hurricane database.[4]
- ^ A major hurricane is an Atlantic or Pacific hurricane that reaches Category 3 or higher on the five-level Saffir–Simpson scale, with maximum sustained winds of at least 111 mph (179 km/h).[1]
- ^ Operationally, Bret was redesignated as Tropical Depression Eight-E late on August 10 in anticipation that it would emerge over the Pacific Ocean as a tropical cyclone, though this did not occur.[21] The remnants of Bret regenerated into a tropical cyclone on August 15, which became Hurricane Greg of the 1993 Pacific hurricane season.[22]
See also
 Tropical cyclones portal

- Timeline of the 1993 Pacific hurricane season
- List of Atlantic hurricanes
- Atlantic hurricane season
- Tropical cyclones in 1993
References
- ^ a b c d e f g "Tropical Cyclone Climatology". Miami, Florida: National Hurricane Center. Archived from the original on February 23, 2024. Retrieved February 17, 2024.
- ^ a b c d e f Avila, Lixion (June 30, 1993). Tropical Depression One Preliminary Report (Page One) (GIF) (Report). Miami, Florida: National Hurricane Center. Archived from the original on August 31, 2020. Retrieved April 1, 2024.
- ^ a b c d Lawrence, Miles (October 22, 1993). Tropical Depression Ten Preliminary Report (GIF) (Report). National Hurricane Center. Archived from the original on September 1, 2021. Retrieved April 17, 2024.
- ^ Landsea, Christopher W.; et al. (December 2012). Documentation of Atlantic Tropical Cyclones Changes in HURDAT. Atlantic Oceanographic and Meteorological Laboratory (Report). Miami, Florida: National Oceanic and Atmospheric Administration. Retrieved May 1, 2024.
- ^ a b c d Pasch, Richard J.; Rappaport, Edward N. (March 1, 1995). "Atlantic Hurricane Season of 1993". Monthly Weather Review. 123 (3). American Meteorological Society: 871–886. Bibcode:1995MWRv..123..871P. doi:10.1175/1520-0493(1995)123<0871:AHSO>2.0.CO;2.
- ^ Gray, William M. (November 19, 1993). "Extended Range Forecast of Atlantic Seasonal Hurricane Activity for 1994" (PDF). Colorado State University. Archived from the original (PDF) on May 5, 2016. Retrieved April 30, 2024.
- ^ GEO Centroamérica Perpectivas del medio ambiente 2004 (PDF) (Report) (in Spanish). Geneva, Switzerland: Programa de las Naciones Unidas para el Medio Ambiente. 2004. p. 101. Archived (PDF) from the original on August 29, 2021. Retrieved April 30, 2024.
- ^ Mexico: Tropical Storm Oct 1993 – UN DHA Situation Reports 1–3. ReliefWeb (Report). Geneva, Switzerland: United Nations Department of Humanitarian Affairs. October 1, 1993. Archived from the original on October 20, 2021. Retrieved April 30, 2024.
- ^ "Hurricane season". Chicago Tribune. Chicago, Illinois. June 6, 1993. Archived from the original on April 30, 2024. Retrieved April 30, 2024 – via Newspapers.com.
- ^ Rappaport, Edward N. (December 9, 1993). Tropical Storm Arlene Preliminary Report (Page Three) (GIF) (Report). Miami, Florida: National Hurricane Center. Archived from the original on December 29, 2022. Retrieved April 30, 2024.
- ^ Mayfield, Max (October 25, 1993). Tropical Storm Cindy Preliminary Report (Page Two) (GIF) (Report). Miami, Florida: National Hurricane Center. Archived from the original on December 29, 2022. Retrieved April 30, 2024.
- ^ "Understanding the Date/Time Stamps". Silver Spring, Maryland: National Oceanic and Atmospheric Administration. Archived from the original on February 26, 2023. Retrieved July 10, 2020.
- ^ "Update on National Hurricane Center Products and Services for 2020" (PDF). Miami, Florida: National Hurricane Center. April 20, 2020. Archived (PDF) from the original on November 28, 2023. Retrieved May 12, 2023.
- ^ a b c d Avila, Lixion (June 30, 1993). Tropical Depression One Preliminary Report (Page Three) (GIF) (Report). Miami, Florida: National Hurricane Center. Archived from the original on August 15, 2016. Retrieved April 1, 2024.
- ^ Rappaport, Edward N. (December 9, 1993). Tropical Storm Arlene Preliminary Report (Page One) (GIF) (Report). Miami, Florida: National Hurricane Center. Archived from the original on August 31, 2021. Retrieved April 2, 2024.
- ^ a b c d e Rappaport, Edward N. (December 9, 1993). Tropical Storm Arlene Preliminary Report (Page Five) (GIF) (Report). Miami, Florida: National Hurricane Center. Archived from the original on April 2, 2024. Retrieved April 2, 2024.
- ^ a b c d Rappaport, Edward N. (December 9, 1993). Tropical Storm Arlene Preliminary Report (Page Two) (GIF) (Report). Miami, Florida: National Hurricane Center. Archived from the original on August 31, 2020. Retrieved April 2, 2024.
- ^ a b c d e f g Pasch, Richard J. (November 22, 1993). Tropical Storm Bret Preliminary Report (Page One) (GIF) (Report). Miami, Florida: National Hurricane Center. Archived from the original on August 31, 2020. Retrieved April 2, 2024.
- ^ a b c d e f g h i j k l m n Pasch, Richard J. (November 22, 1993). Tropical Storm Bret Preliminary Report (Page Seven) (GIF) (Report). Miami, Florida: National Hurricane Center. Archived from the original on November 11, 2023. Retrieved April 2, 2024.
- ^ a b c d e f g h Pasch, Richard J. (November 22, 1993). Tropical Storm Bret Preliminary Report (Page Two) (GIF) (Report). Miami, Florida: National Hurricane Center. Archived from the original on November 11, 2023. Retrieved April 2, 2024.
- ^ Mayfield, Max (August 10, 1993). Tropical Depression Eight-E Discussion Number 1 (Report). Miami, Florida: National Hurricane Center. Archived from the original on November 12, 2023. Retrieved April 29, 2024.
- ^ Pasch, Richard J. (November 28, 1993). Hurricane Greg Preliminary Report (Page One) (GIF) (Report). National Hurricane Center. Archived from the original on March 4, 2016. Retrieved February 6, 2024.
- ^ a b c d e Mayfield, Max (October 25, 1993). Tropical Storm Cindy Preliminary Report (Page One) (GIF) (Report). Miami, Florida: National Hurricane Center. Archived from the original on August 28, 2021. Retrieved April 7, 2024.
- ^ a b c d e Mayfield, Max (October 25, 1993). Tropical Storm Cindy Preliminary Report (Page Three) (GIF) (Report). Miami, Florida: National Hurricane Center. Archived from the original on October 19, 2017. Retrieved April 7, 2024.
- ^ a b c d e f g h Lawrence, Miles (September 30, 1993). Hurricane Emily Preliminary Report (Page One) (GIF) (Report). Miami, Florida: National Hurricane Center. Archived from the original on August 28, 2021. Retrieved April 11, 2024.
- ^ a b c d e f g h i j k Lawrence, Miles (September 30, 1993). Hurricane Emily Preliminary Report (Page Five) (GIF) (Report). Miami, Florida: National Hurricane Center. Archived from the original on April 11, 2024. Retrieved April 11, 2024.
- ^ a b c d e Avila, Lixion (October 7, 1993). Tropical Storm Dennis Preliminary Report (Page One) (GIF) (Report). Miami, Florida: National Hurricane Center. Archived from the original on December 29, 2022. Retrieved April 11, 2024.
- ^ a b c d e Avila, Lixion (October 7, 1993). Tropical Storm Dennis Preliminary Report (Page Three) (GIF) (Report). Miami, Florida: National Hurricane Center. Archived from the original on April 11, 2024. Retrieved April 11, 2024.
- ^ a b c d e Lawrence, Miles (September 30, 1993). Hurricane Emily Preliminary Report (Page Six) (GIF) (Report). Miami, Florida: National Hurricane Center. Archived from the original on April 11, 2024. Retrieved April 11, 2024.
- ^ a b c Lawrence, Miles (September 30, 1993). Hurricane Emily Preliminary Report (Page Two) (GIF) (Report). Miami, Florida: National Hurricane Center. Archived from the original on March 8, 2024. Retrieved April 11, 2024.
- ^ a b c Rappaport, Edward N. (October 6, 1993). Hurricane Floyd Preliminary Report (Page One) (GIF) (Report). Miami, Florida: National Hurricane Center. Archived from the original on August 31, 2020. Retrieved April 12, 2024.
- ^ a b c d e Rappaport, Edward N. (October 6, 1993). Hurricane Floyd Preliminary Report (Page Four) (GIF) (Report). Miami, Florida: National Hurricane Center. Archived from the original on April 12, 2024. Retrieved April 12, 2024.
- ^ a b Rappaport, Edward N. (October 6, 1993). Hurricane Floyd Preliminary Report (Page Two) (GIF) (Report). Miami, Florida: National Hurricane Center. Archived from the original on August 29, 2021. Retrieved April 12, 2024.
- ^ a b c d Pasch, Richard J. (November 10, 1993). Hurricane Gert Preliminary Report (Page One) (GIF) (Report). Miami, Florida: National Hurricane Center. Archived from the original on October 6, 2023. Retrieved April 15, 2024.
- ^ a b c d e f g h i j k l m n o p q Pasch, Richard J. (November 10, 1993). Hurricane Gert Preliminary Report (Page Five) (GIF) (Report). Miami, Florida: National Hurricane Center. Archived from the original on October 6, 2023. Retrieved April 15, 2024.
- ^ a b c d e f g h i j k l m Pasch, Richard J. (November 10, 1993). Hurricane Gert Preliminary Report (Page Two) (GIF) (Report). Miami, Florida: National Hurricane Center. Archived from the original on October 6, 2023. Retrieved April 15, 2024.
- ^ a b c d e Mayfield, Max (October 19, 1993). Hurricane Harvey Preliminary Report (Page One) (GIF) (Report). Miami, Florida: National Hurricane Center. Archived from the original on August 31, 2020. Retrieved April 17, 2024.
- ^ a b c d e Mayfield, Max (October 19, 1993). Hurricane Harvey Preliminary Report (Page Three) (GIF) (Report). Miami, Florida: National Hurricane Center. Archived from the original on April 17, 2024. Retrieved April 17, 2024.
- ^ Rappaport, Edward (September 29, 1993). Tropical Depression Fourteen-E Preliminary Report (Page One) (GIF) (Report). National Hurricane Center. Archived from the original on October 7, 2023. Retrieved April 16, 2024.
External links
Wikimedia Commons has media related to 1993 Atlantic hurricane season.
- The National Hurricane Center's storm wallet for the 1993 Atlantic hurricane season